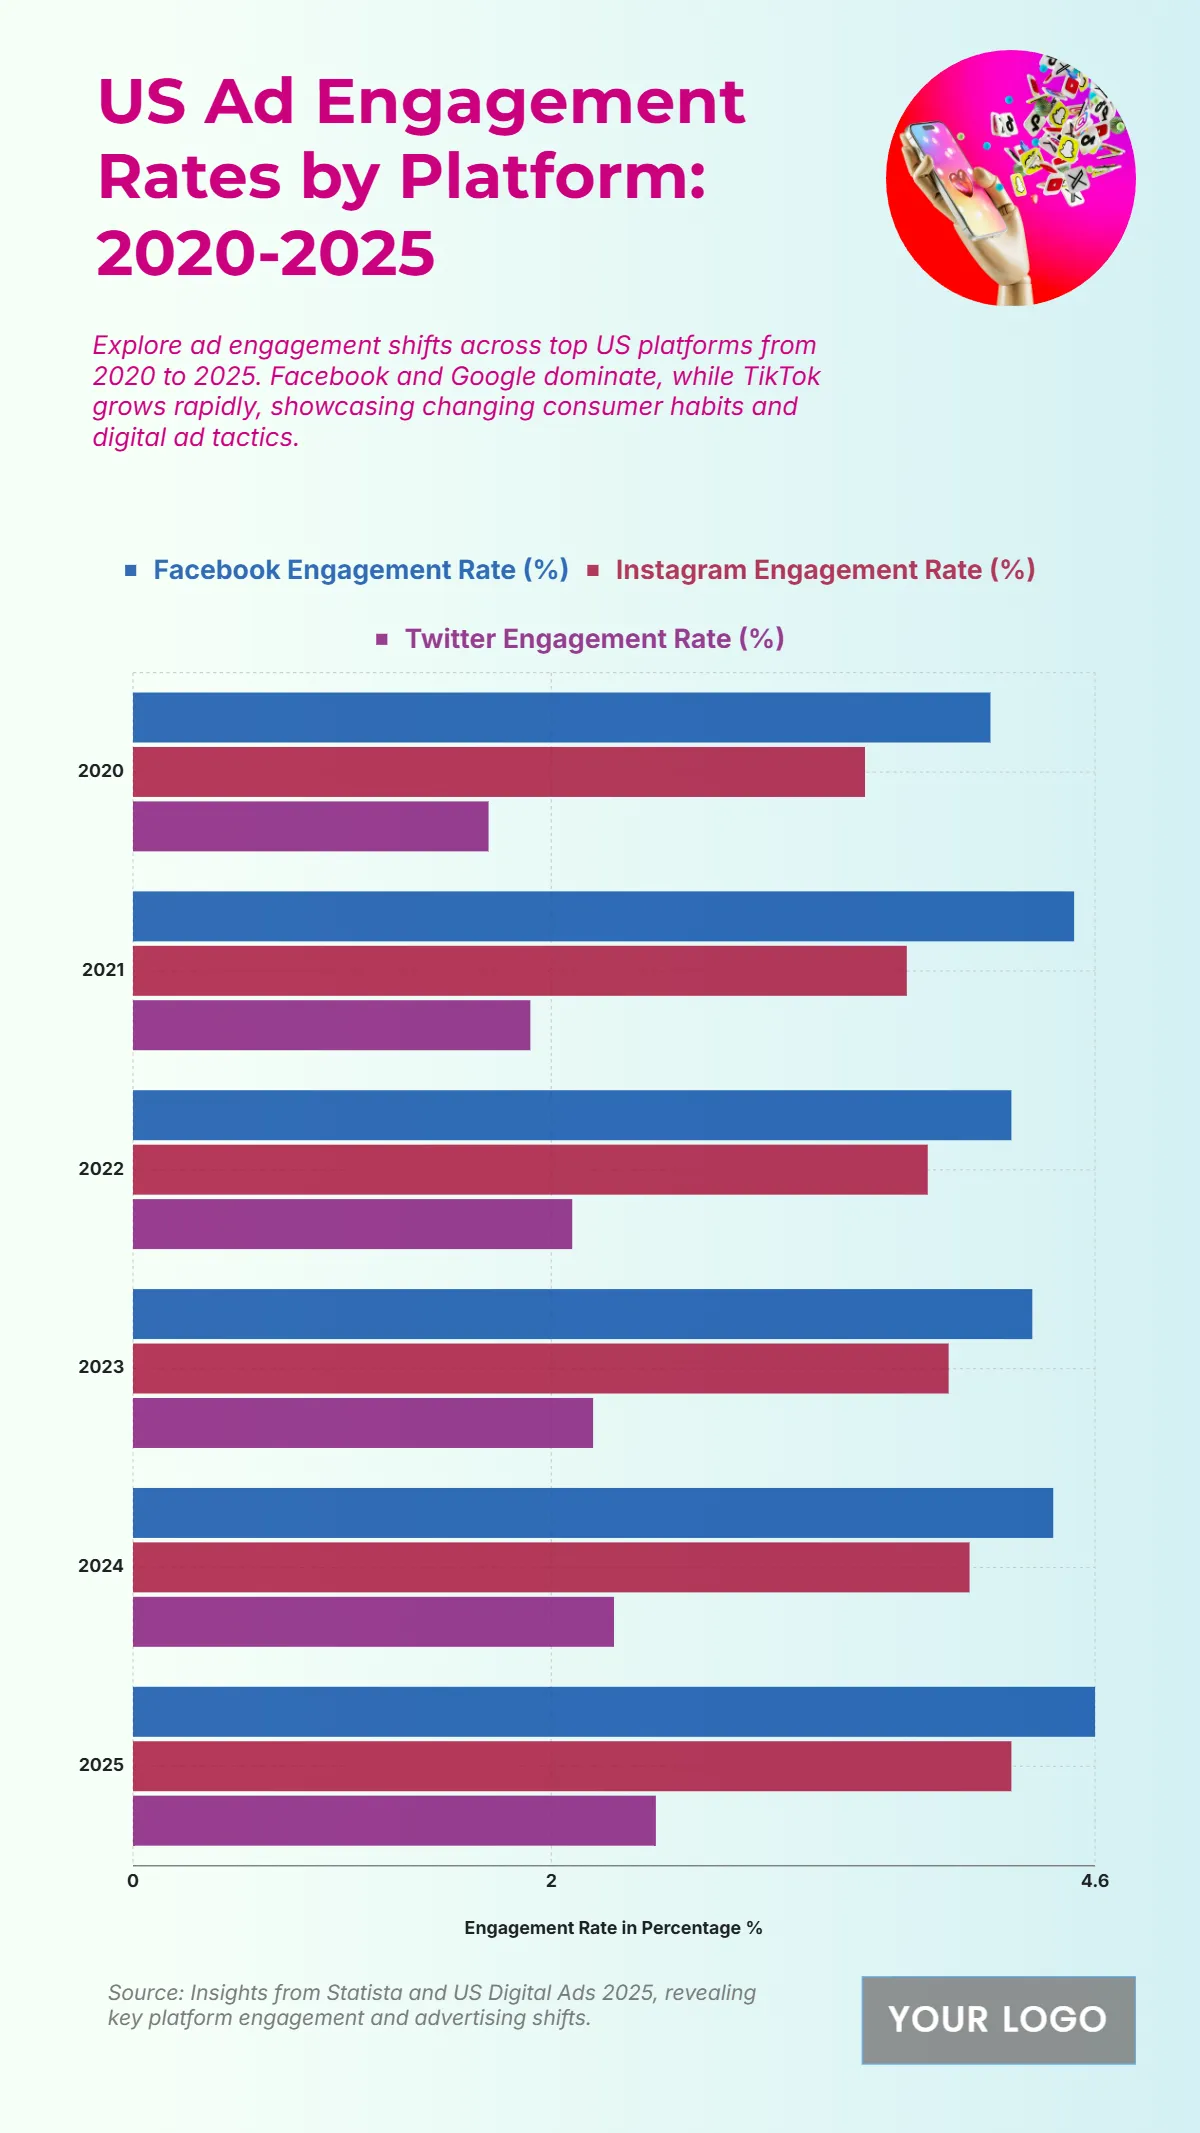
Free US Ad Engagement Rates by Platform from 2020 to 2025 Chart
The chart presents a comparison of US ad engagement rates across Facebook, Instagram, and Twitter from 2020 to 2025, revealing notable trends in platform performance. Facebook consistently leads, maintaining the highest engagement rates averaging around 4.4% over the years, underscoring its dominance in user interaction and ad effectiveness. Instagram follows closely, with engagement rates averaging 3.8%, reflecting its strong visual and influencer-driven appeal that continues to captivate audiences. Meanwhile, Twitter remains the lowest, with rates hovering near 2.3%, showing limited engagement compared to its competitors despite steady usage for real-time updates and discussions. Across the five-year span, the data indicates stable engagement for Facebook and Instagram, while Twitter shows minor fluctuations. These patterns highlight how advertisers continue to prioritize visual and interactive platforms for digital campaigns, emphasizing the sustained strength of Facebook and Instagram in driving user engagement and optimizing ad performance through 2025.
| Labels | 2020–2025 Expenditure (in millions) |
|---|---|
| Television | 30 |
| Digital | 25 |
| Radio | 15 |
| 10 | |
| Social Media | 20 |


