Free US Out-of-Home Digital Advertising Growth from 2015 to 2025 Chart
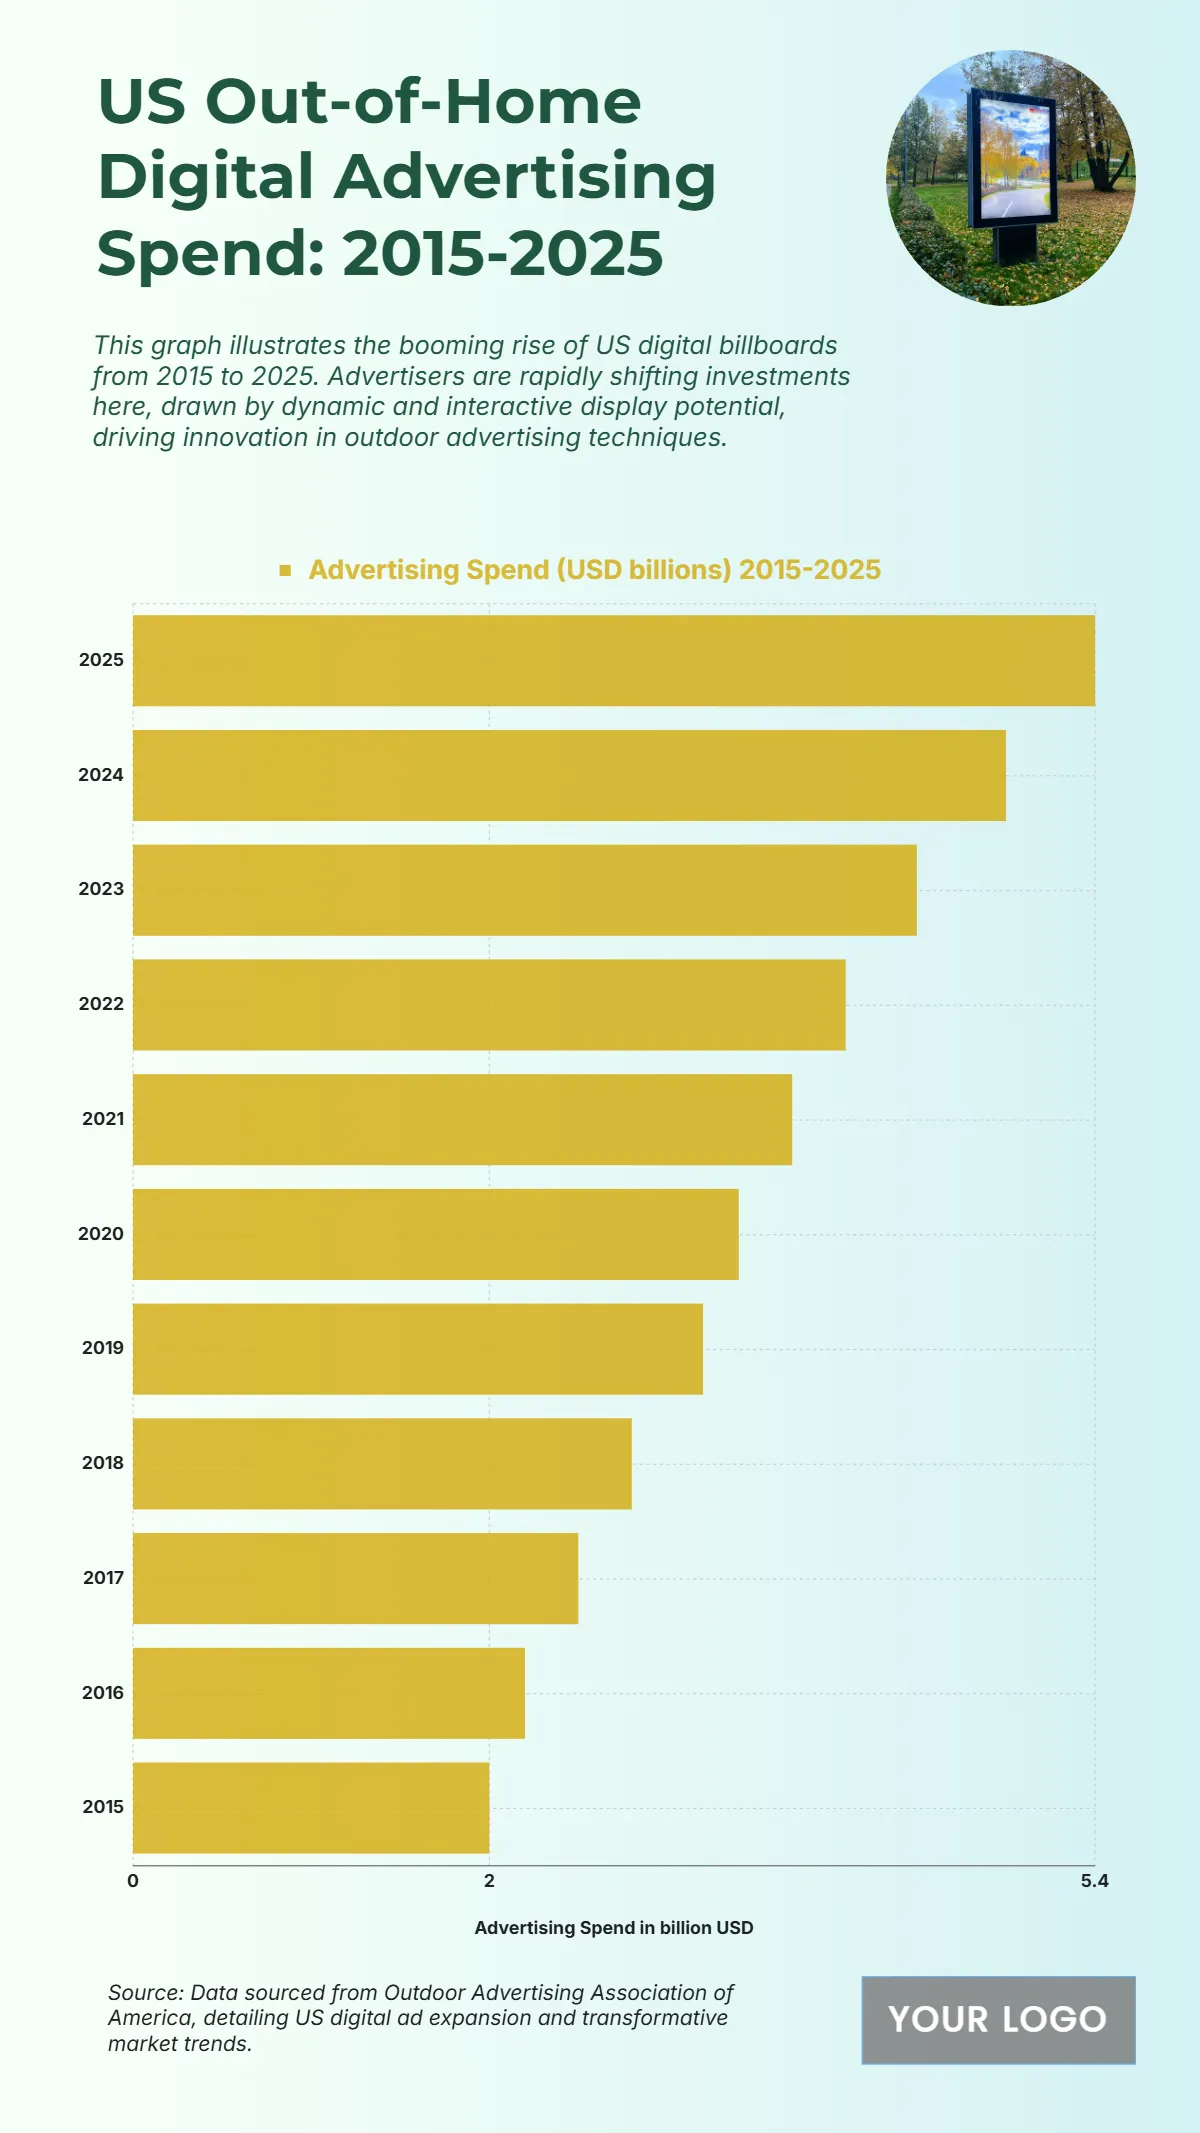
The chart shows a consistent rise in US digital out-of-home advertising spending from 2015 to 2025, reflecting the rapid adoption of digital billboards and interactive outdoor displays. Spending increased from $2 billion in 2015 to an estimated $5.2 billion by 2025, marking a substantial growth driven by technological innovation and visual engagement. Between 2016 and 2018, expenditures climbed gradually from $2.3 billion to $2.8 billion, followed by steady increases in 2019 ($3.1 billion) and 2020 ($3.4 billion). The acceleration continued as spending reached $3.7 billion in 2021, $4.1 billion in 2022, and $4.5 billion in 2023, before surging to $4.8 billion in 2024. This steady upward trend emphasizes advertisers’ strategic pivot toward digital outdoor formats offering flexibility, data integration, and higher visibility. Overall, the decade’s data illustrates how digital out-of-home advertising became a key component of US marketing strategies, reshaping public engagement through smart, connected displays.
| Labels | Advertising Spend (USD billions) 2015–2025 |
|---|---|
| 2025 | 5.4 |
| 2024 | 4.9 |
| 2023 | 4.4 |
| 2022 | 4.0 |
| 2021 | 3.7 |
| 2020 | 3.4 |
| 2019 | 3.2 |
| 2018 | 2.8 |
| 2017 | 2.5 |
| 2016 | 2.2 |
| 2015 | 2.0 |


