Free US Social Media Video Advertising Growth from 2015 to 2025 Chart
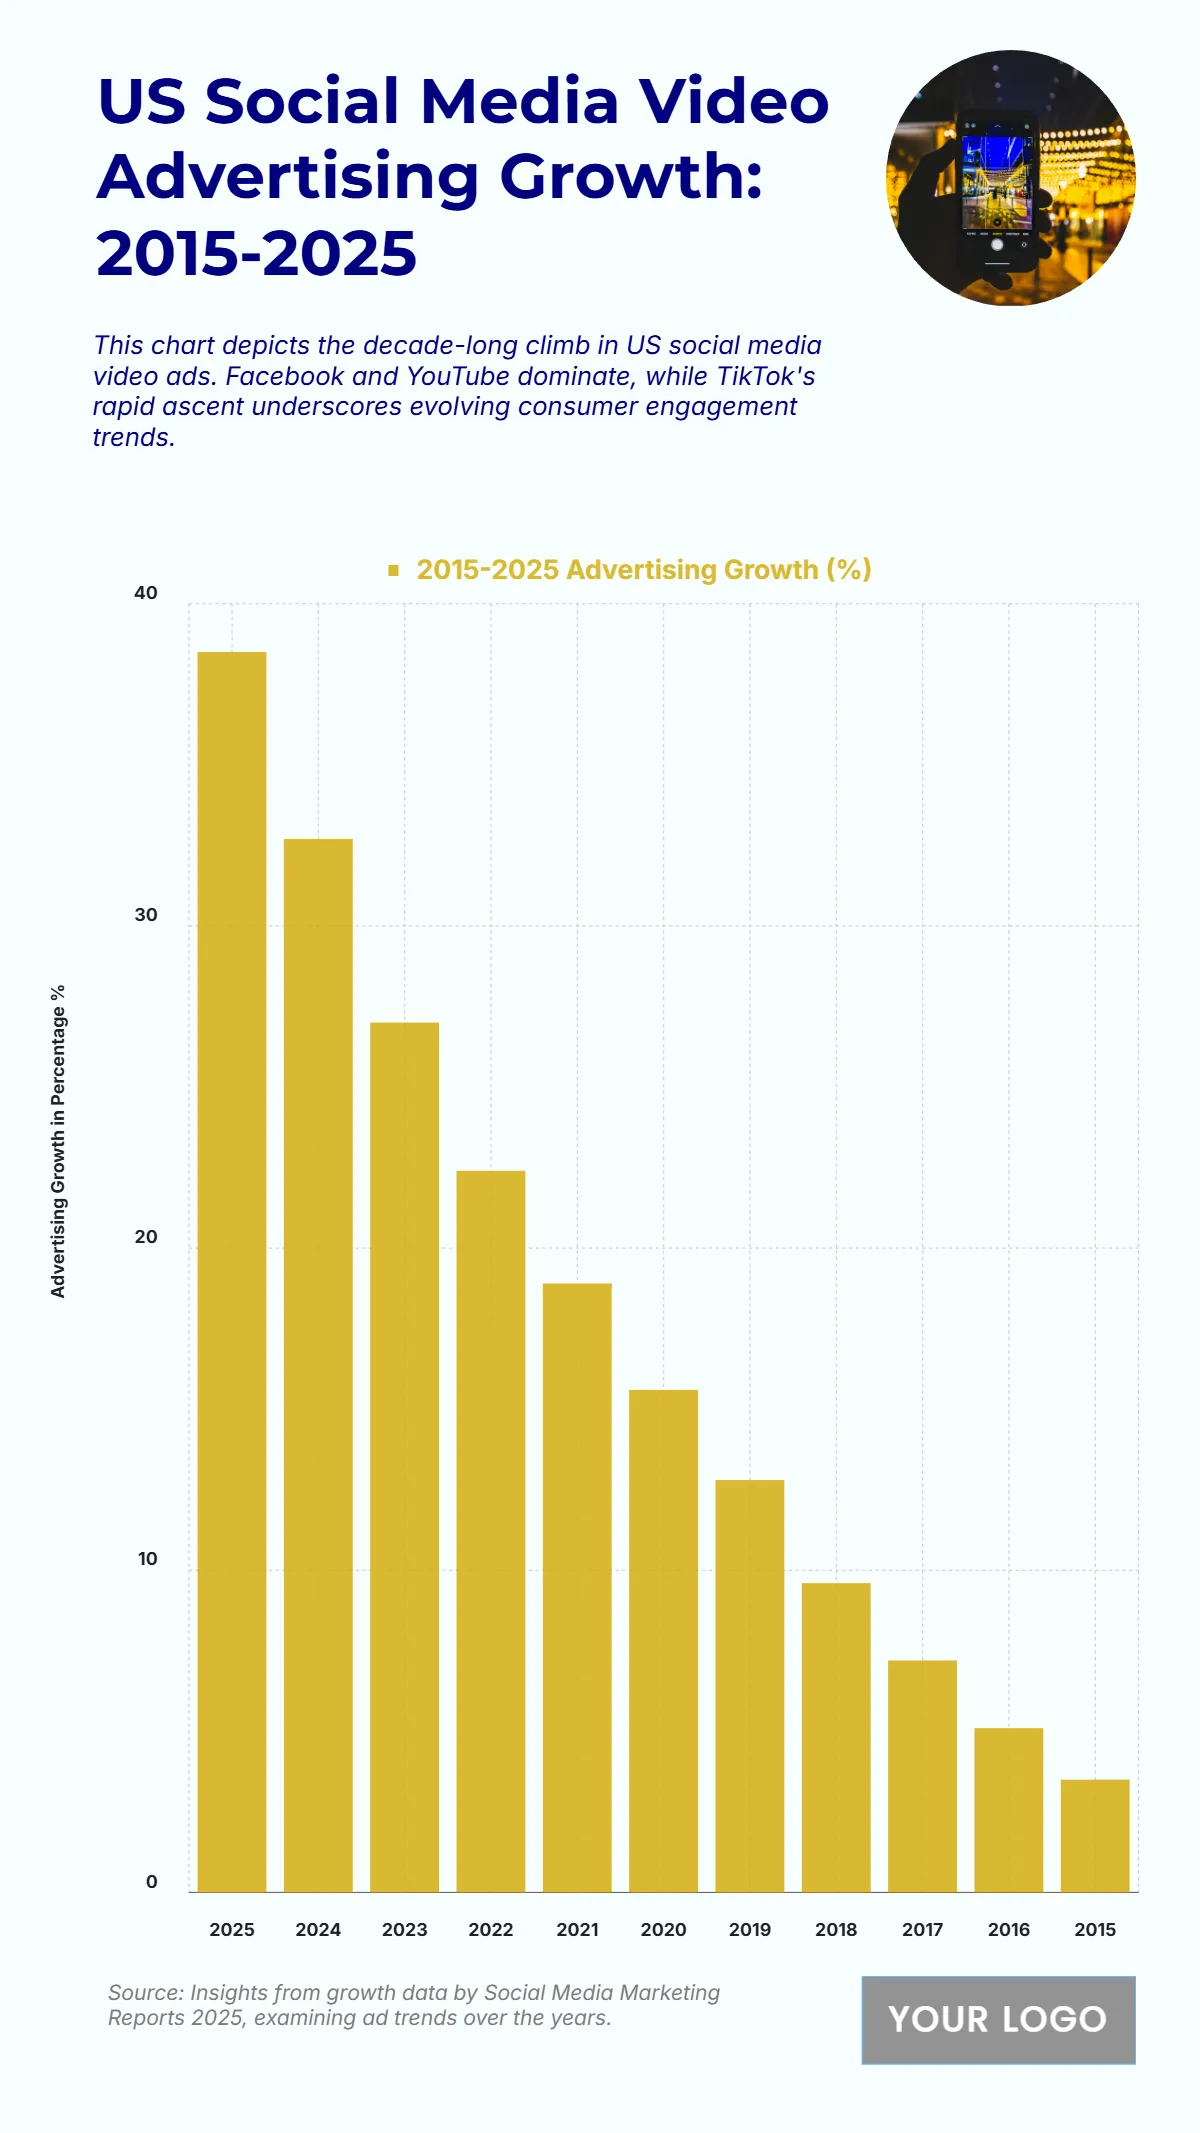
The chart shows the rapid and consistent growth of US social media video advertising from 2015 to 2025, reflecting the major shift toward digital video platforms. The advertising growth rate increased significantly, rising from 5% in 2015 to a projected 38% in 2025. Early years saw gradual gains, reaching 8% in 2016, 11% in 2017, and 14% in 2018, before momentum accelerated to 18% in 2020. By 2021, growth climbed to 22%, reaching 26% in 2023, and further surging to 33% in 2024. This steady rise highlights the dominance of platforms like Facebook, YouTube, and TikTok, which have transformed advertising strategies through immersive video content and targeted campaigns. The upward trajectory underscores the increasing reliance of brands on video ads to drive engagement, visibility, and consumer interaction, positioning social media as the leading channel for advertising innovation and audience reach by 2025.
| Labels | 2015–2025 Advertising Growth (%) |
|---|---|
| 2025 | 38.5 |
| 2024 | 32.7 |
| 2023 | 27 |
| 2022 | 22.4 |
| 2021 | 18.9 |
| 2020 | 15.6 |
| 2019 | 12.8 |
| 2018 | 9.6 |
| 2017 | 7.2 |
| 2016 | 5.1 |
| 2015 | 3.5 |


