Free US Digital Advertising Click-Through Rates by Device from 2020 to 2025 Chart
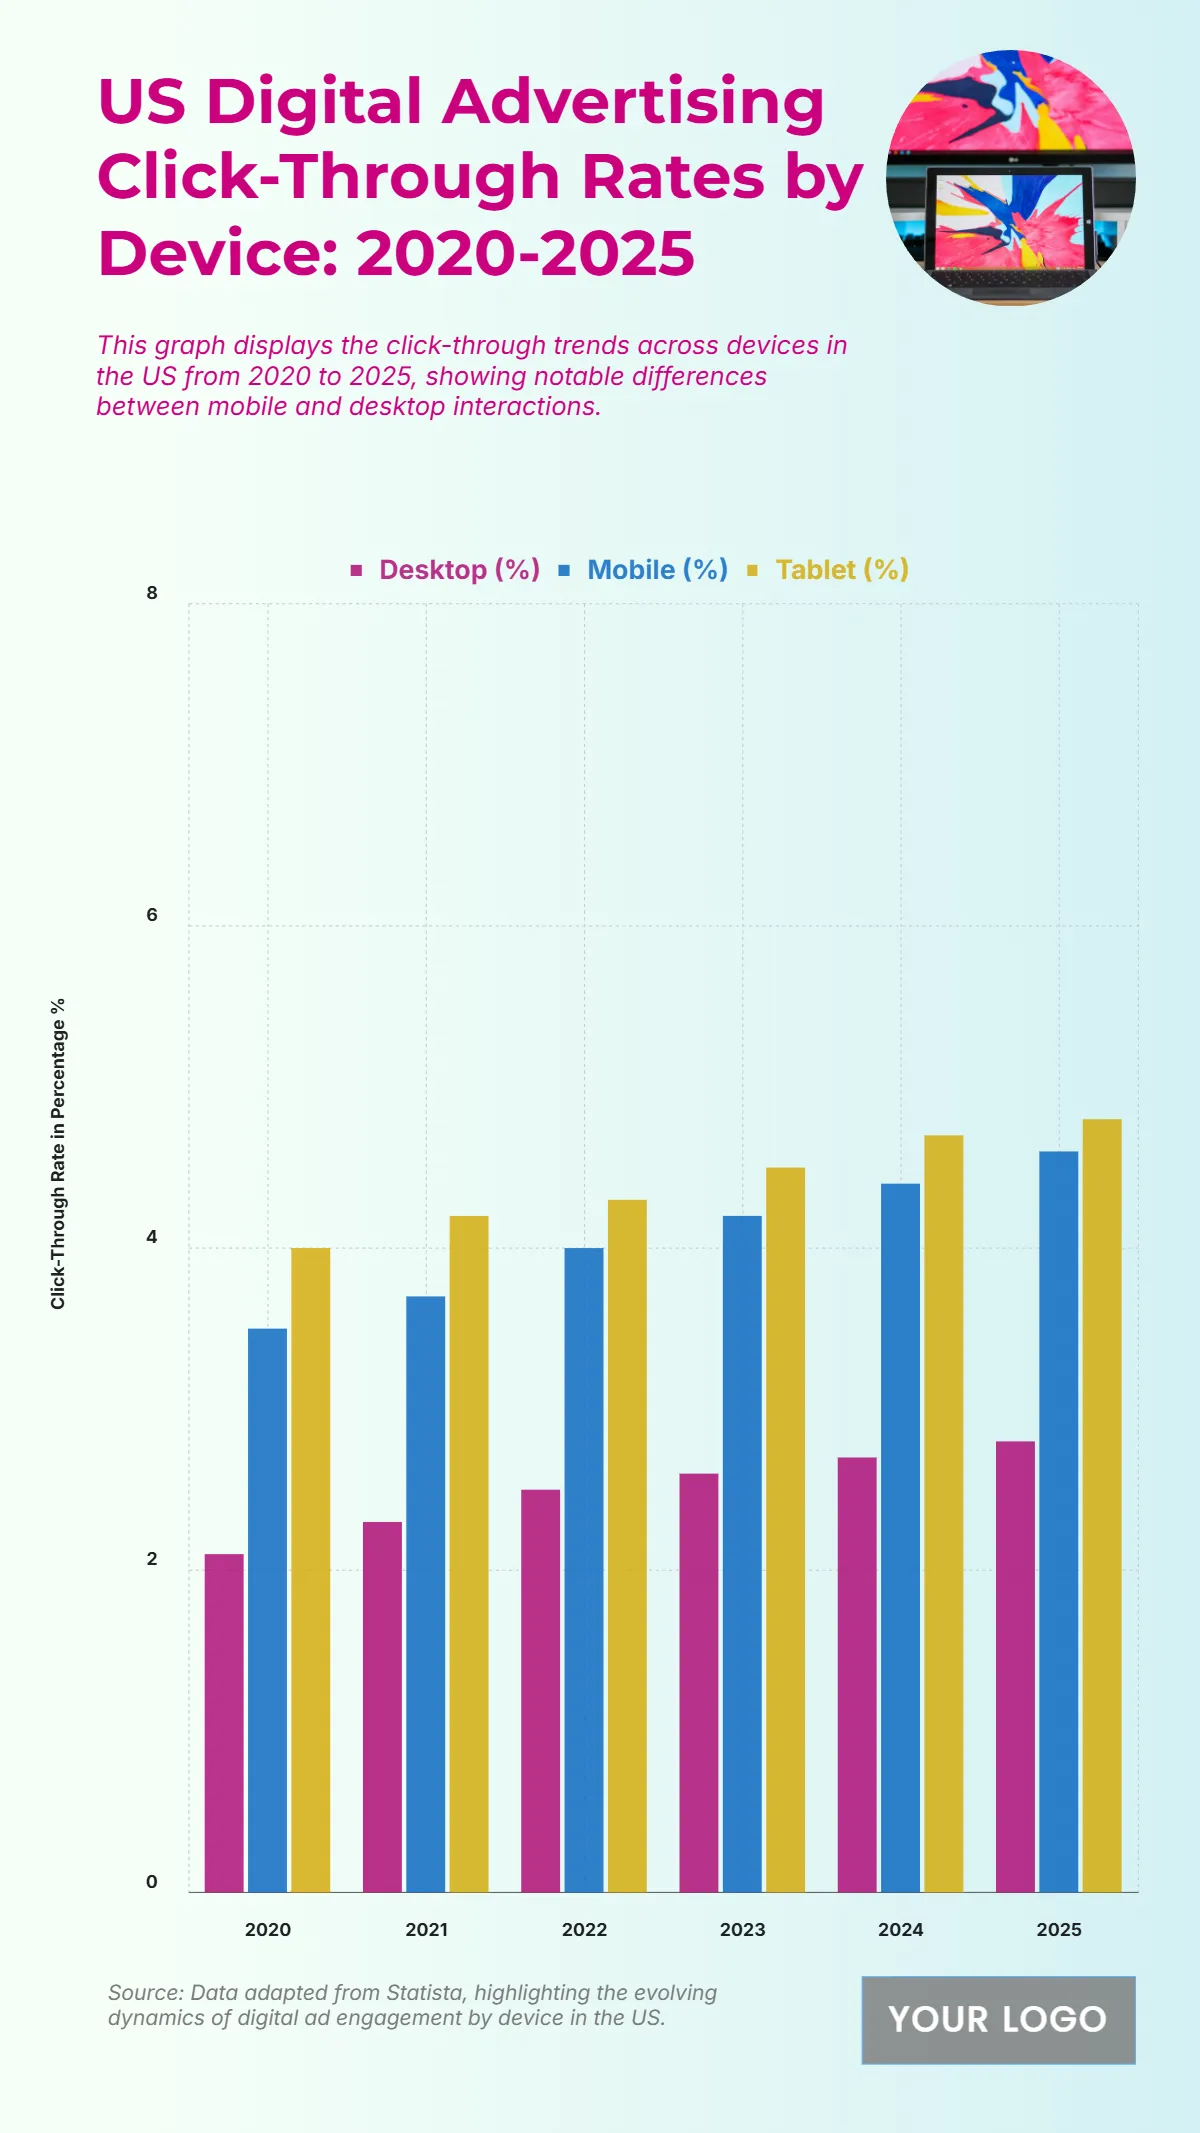
The chart shows the steady rise in click-through rates (CTR) across desktop, mobile, and tablet devices in the US from 2020 to 2025, illustrating how digital engagement has evolved with changing user behavior. Mobile devices consistently lead in CTR, growing from 3.3% in 2020 to 4.8% in 2025, emphasizing their dominance in user interactions. Tablets follow closely, increasing from 4% in 2020 to 5% in 2025, reflecting strong engagement in visual ad formats. Meanwhile, desktop click-through rates improved gradually from 2% in 2020 to 2.7% in 2025, indicating steady but slower growth compared to mobile. The upward trend across all devices highlights advertisers’ growing optimization for multiple screens and the shift toward mobile-first marketing strategies. This data underscores the continuous adaptation of digital ad campaigns to device usage trends, showing how mobile and tablet ads drive stronger engagement than traditional desktop placements by 2025.
| Labels | Desktop (%) | Mobile (%) | Tablet (%) |
|---|---|---|---|
| 2020 | 2.1 | 3.5 | 4.0 |
| 2021 | 2.3 | 3.7 | 4.2 |
| 2022 | 2.5 | 4.0 | 4.3 |
| 2023 | 2.6 | 4.2 | 4.5 |
| 2024 | 2.7 | 4.4 | 4.7 |
| 2025 | 2.8 | 4.6 | 4.8 |


