Free US Advertising Expenditure by Platform from 2020 to 2025 Chart
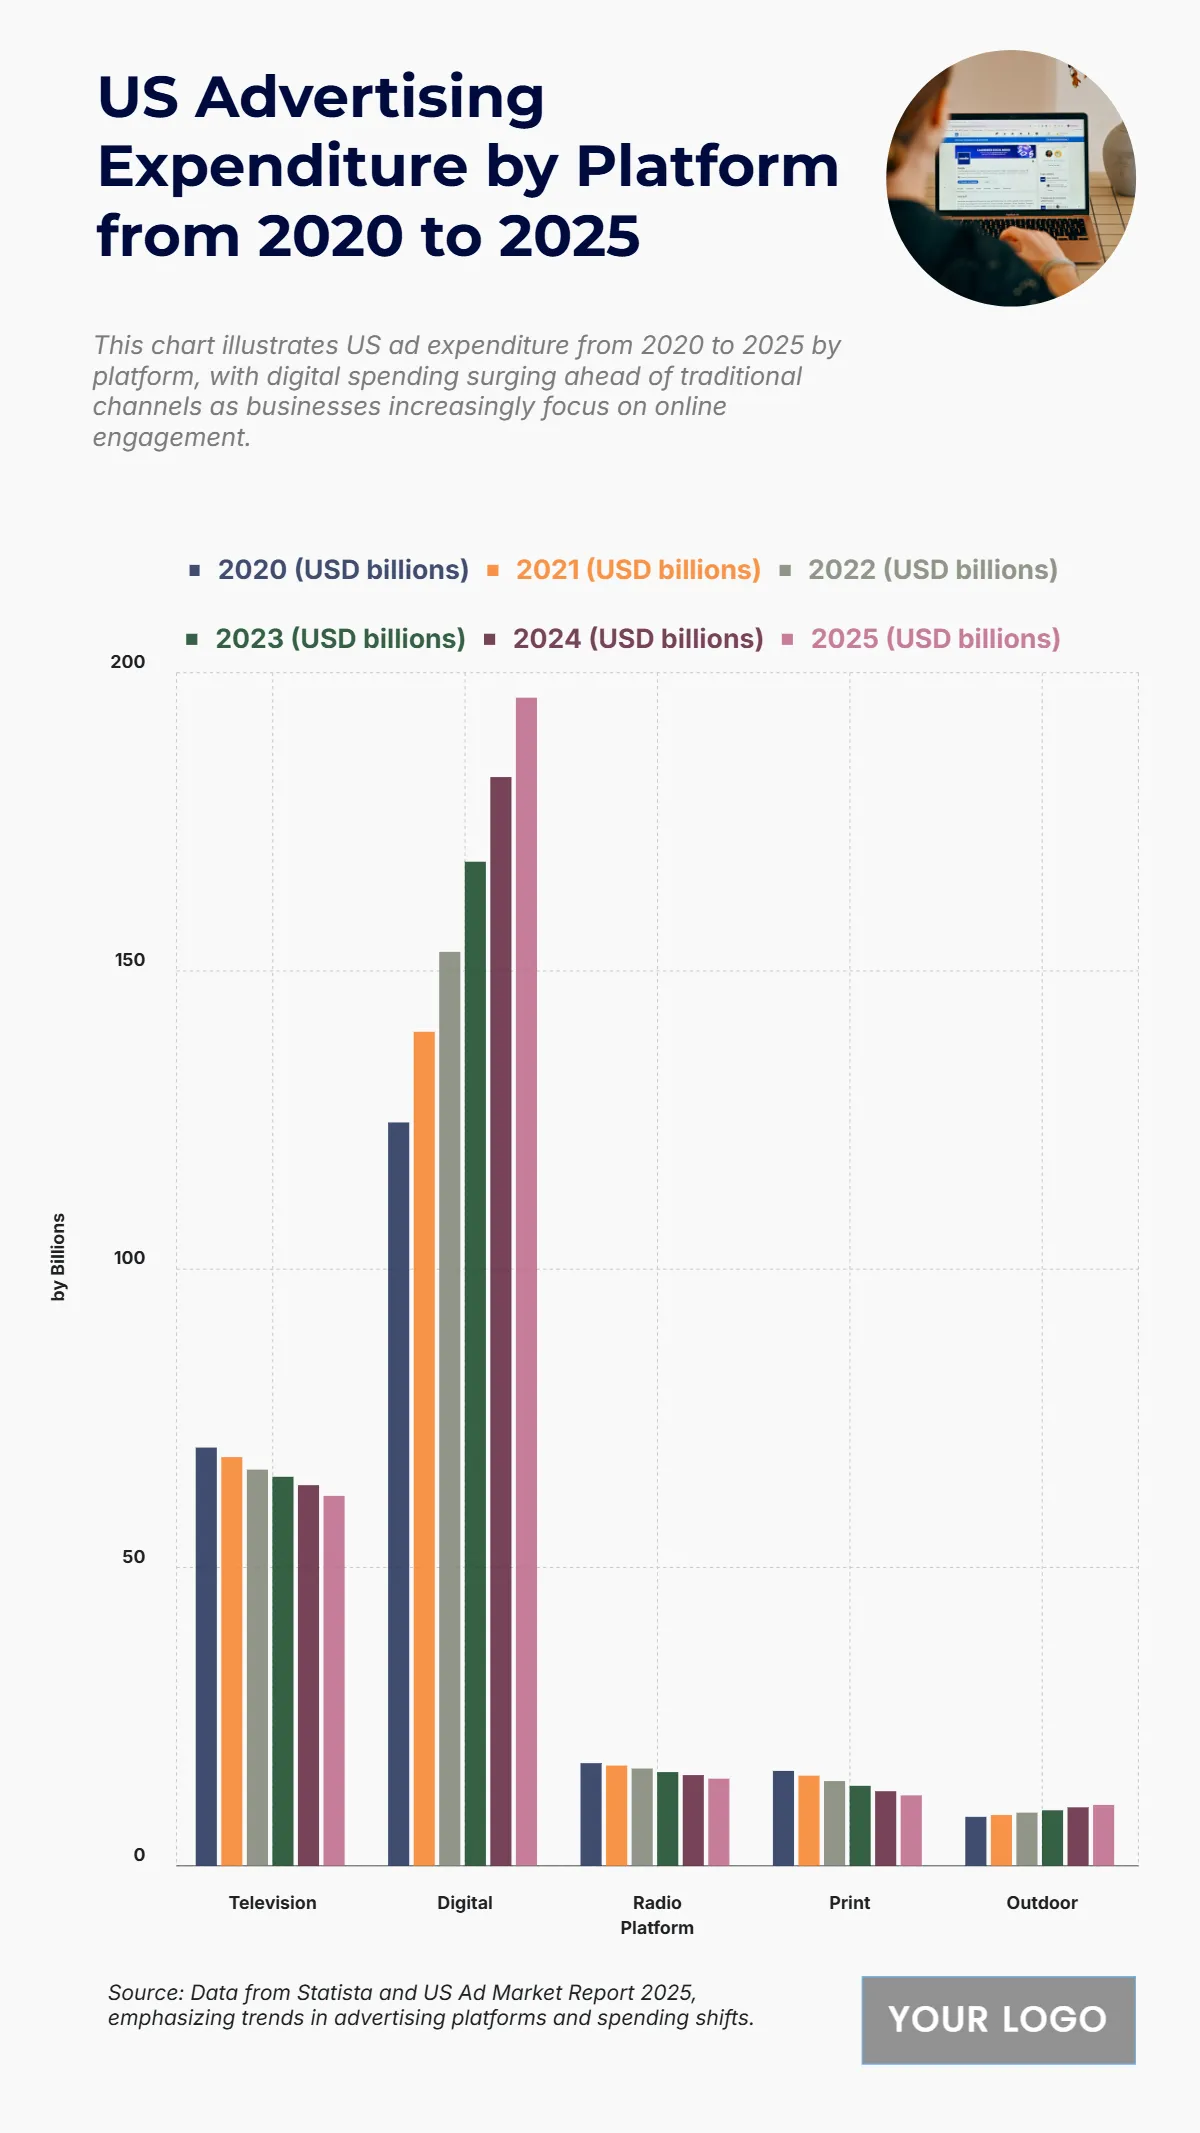
The chart outlines how advertising expenditure has shifted across major platforms between 2020 and 2025, showing a strong migration toward digital media. Digital ad spending grew from USD 124.6 billion in 2020 to a projected USD 195.8 billion in 2025, marking the most significant rise and confirming its dominance in the ad landscape. Television spending declined steadily from USD 70.1 billion in 2020 to USD 62 billion in 2025, reflecting the shift away from traditional broadcasting. Radio experienced a modest decrease, going from USD 17.2 billion to USD 14.6 billion over the same period, while print media fell sharply from USD 15.9 billion to USD 11.8 billion, showing shrinking investment. Outdoor advertising rose slightly from USD 8.2 billion in 2020 to USD 10.2 billion in 2025, maintaining its niche appeal. Overall, the data highlights a clear transition in ad budgets favoring digital platforms over traditional channels.
| Labels | 2020 (USD billions) | 2021 (USD billions) | 2022 (USD billions) | 2023 (USD billions) | 2024 (USD billions) | 2025 (USD billions) |
|---|---|---|---|---|---|---|
| Television | 70.1 | 68.5 | 66.4 | 65.2 | 63.8 | 62 |
| Digital | 124.6 | 139.8 | 153.2 | 168.3 | 182.5 | 195.8 |
| Radio | 17.2 | 16.8 | 16.3 | 15.7 | 15.2 | 14.6 |
| 15.9 | 15.1 | 14.2 | 13.4 | 12.5 | 11.8 | |
| Outdoor | 8.2 | 8.5 | 8.9 | 9.3 | 9.8 | 10.2 |


