Free US Video Ad Market Share by Platform from 2015 to 2025 Chart
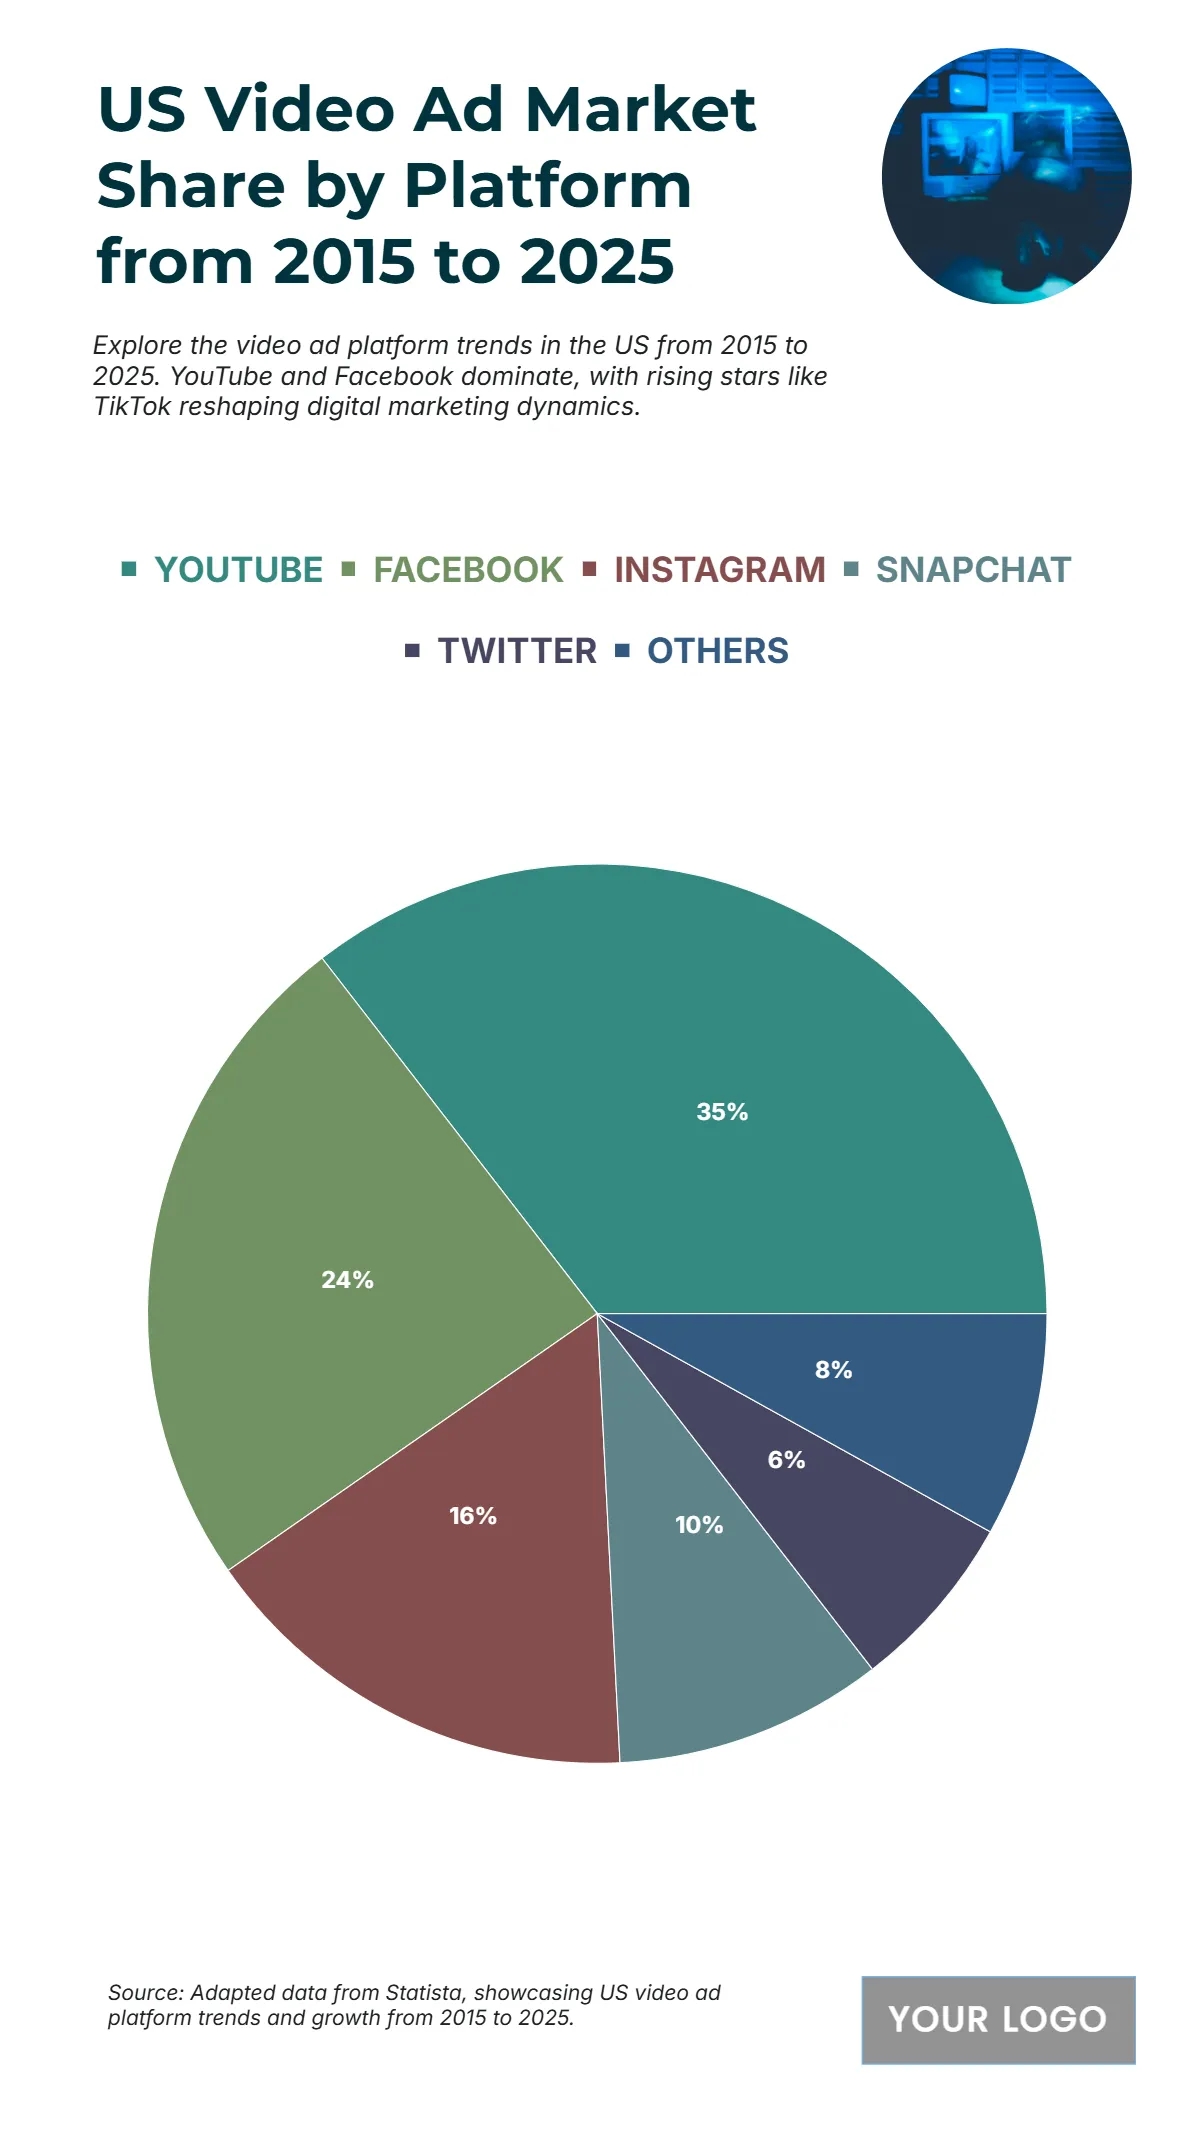
The chart highlights the distribution of US Video Ad Market Share by Platform from 2015 to 2025, revealing how major social platforms dominate digital video advertising. YouTube leads the market with a commanding 22% share, emphasizing its strong influence and reach in video-based marketing. Facebook follows with 15%, maintaining its position as a core player for both social and video advertising. Instagram secures 10%, reflecting its growing importance for visual storytelling and influencer-driven content. Meanwhile, Snapchat holds 6%, driven by younger demographics and short-form video trends. Twitter, though smaller in scale, contributes 4% to the overall market, focusing on news-driven and real-time engagement ads. The remaining 5% falls under other platforms, showing emerging players gaining traction in the competitive video advertising ecosystem.
| Labels | Total Market Share (%) |
|---|---|
| YouTube | 22 |
| 15 | |
| 10 | |
| Snapchat | 6 |
| 4 | |
| Others | 5 |


