Free US Mobile Advertising Spend Growth from 2020 to 2025 Chart
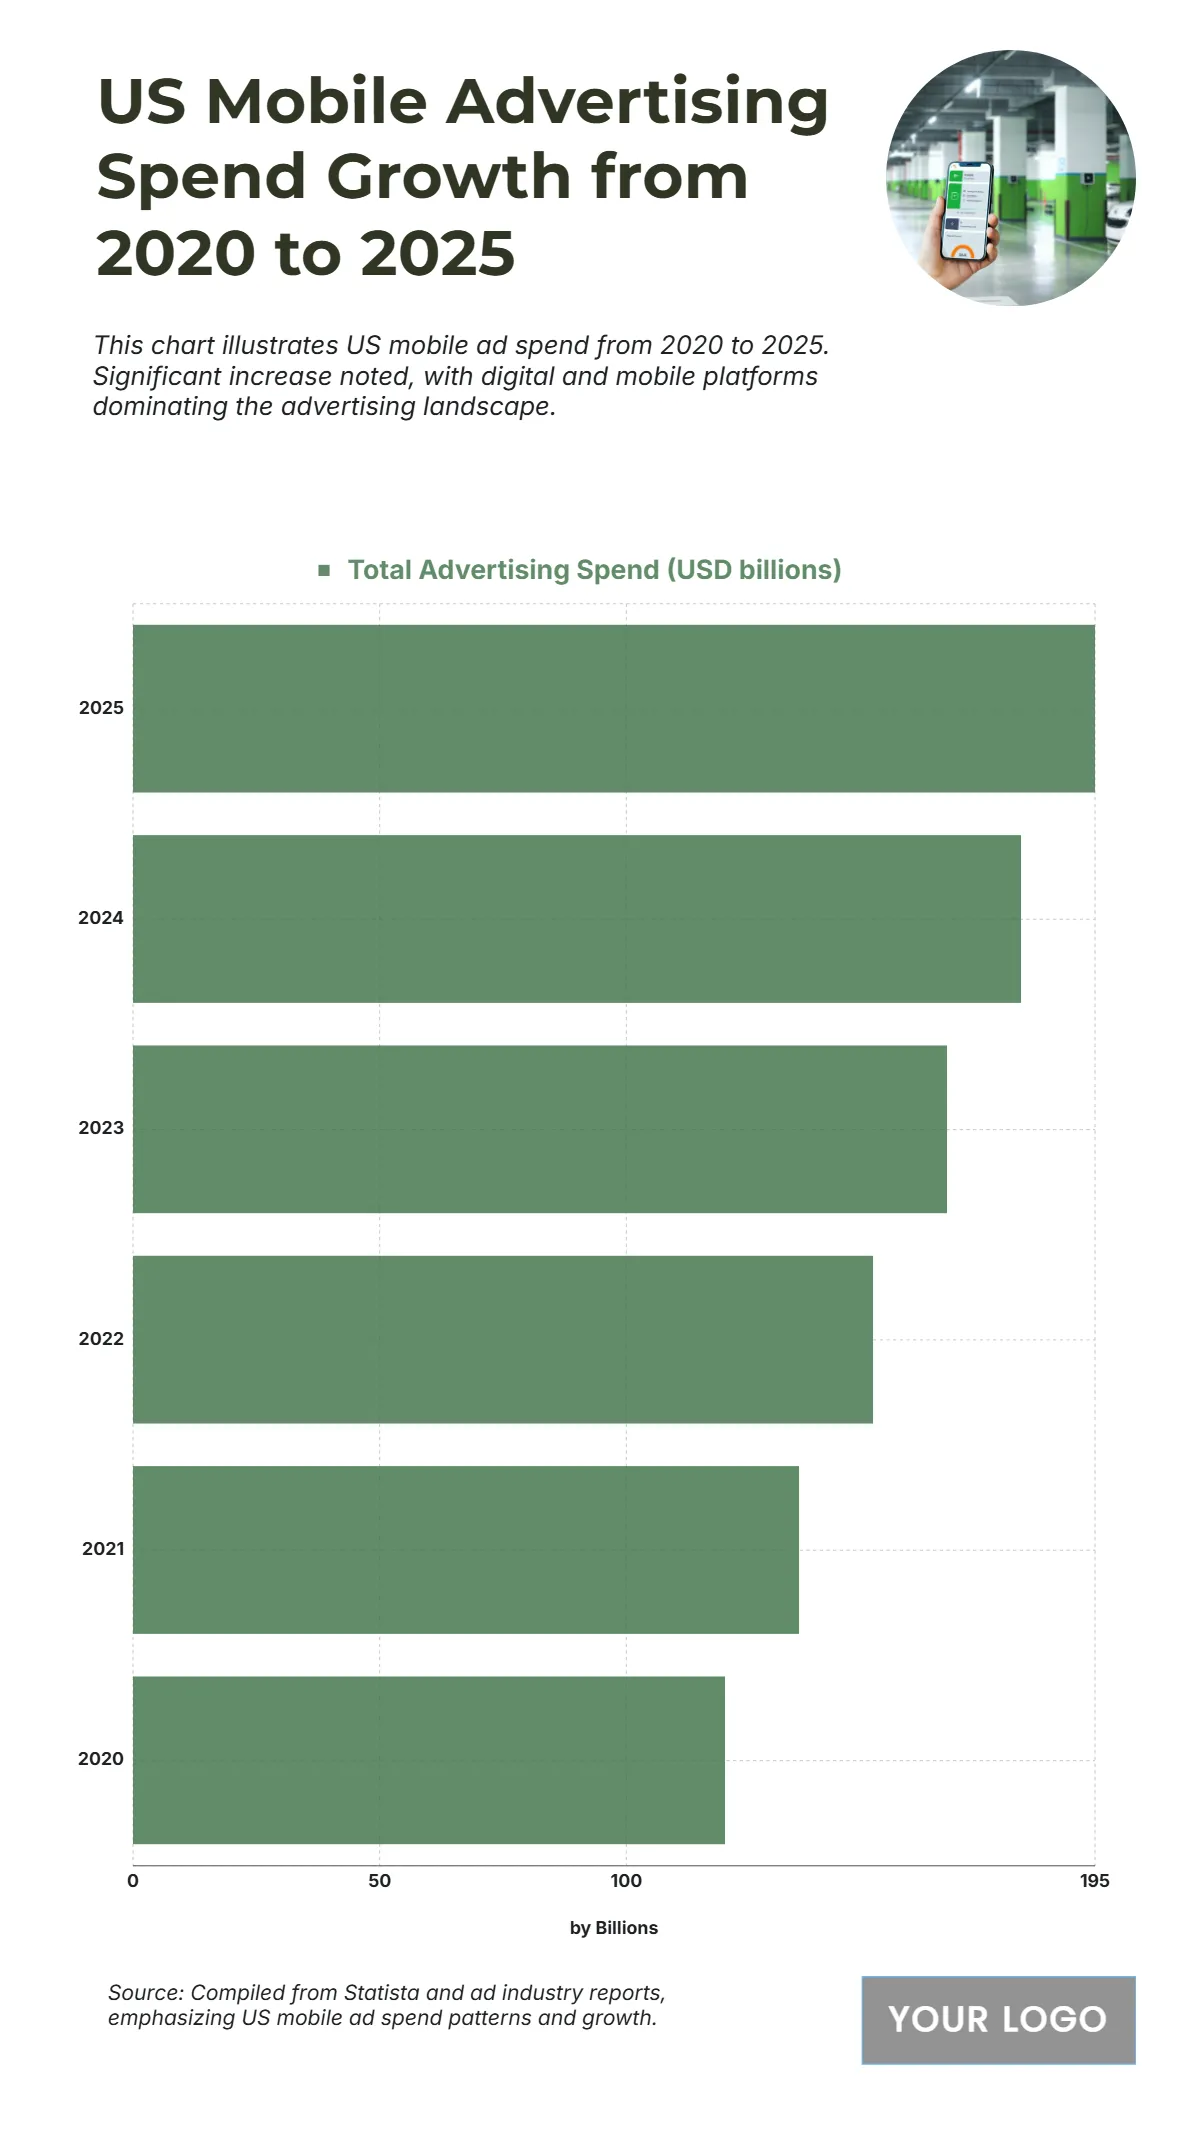
The chart showcases the steady increase in US Mobile Advertising Spend from 2020 to 2025, emphasizing the growing dominance of mobile platforms in the digital advertising ecosystem. In 2020, spending began at USD 120 billion, marking a strong foundation for mobile-driven marketing. By 2021, it grew to USD 135 billion, and in 2022, it climbed further to USD 150 billion, highlighting a consistent annual rise as mobile usage and e-commerce surged. In 2023, ad expenditure reached USD 165 billion, driven by improved ad targeting and app-based promotions. The upward trajectory continued with USD 180 billion in 2024, and the forecast for 2025 peaks at USD 195 billion, signifying a cumulative growth of over USD 75 billion within five years. This sharp increase reflects the shift from desktop to mobile advertising, powered by video content, social media engagement, and in-app ad innovations.
| Labels | Total Advertising Spend (USD billions) |
|---|---|
| 2025 | 195 |
| 2024 | 180 |
| 2023 | 165 |
| 2022 | 150 |
| 2021 | 135 |
| 2020 | 120 |


