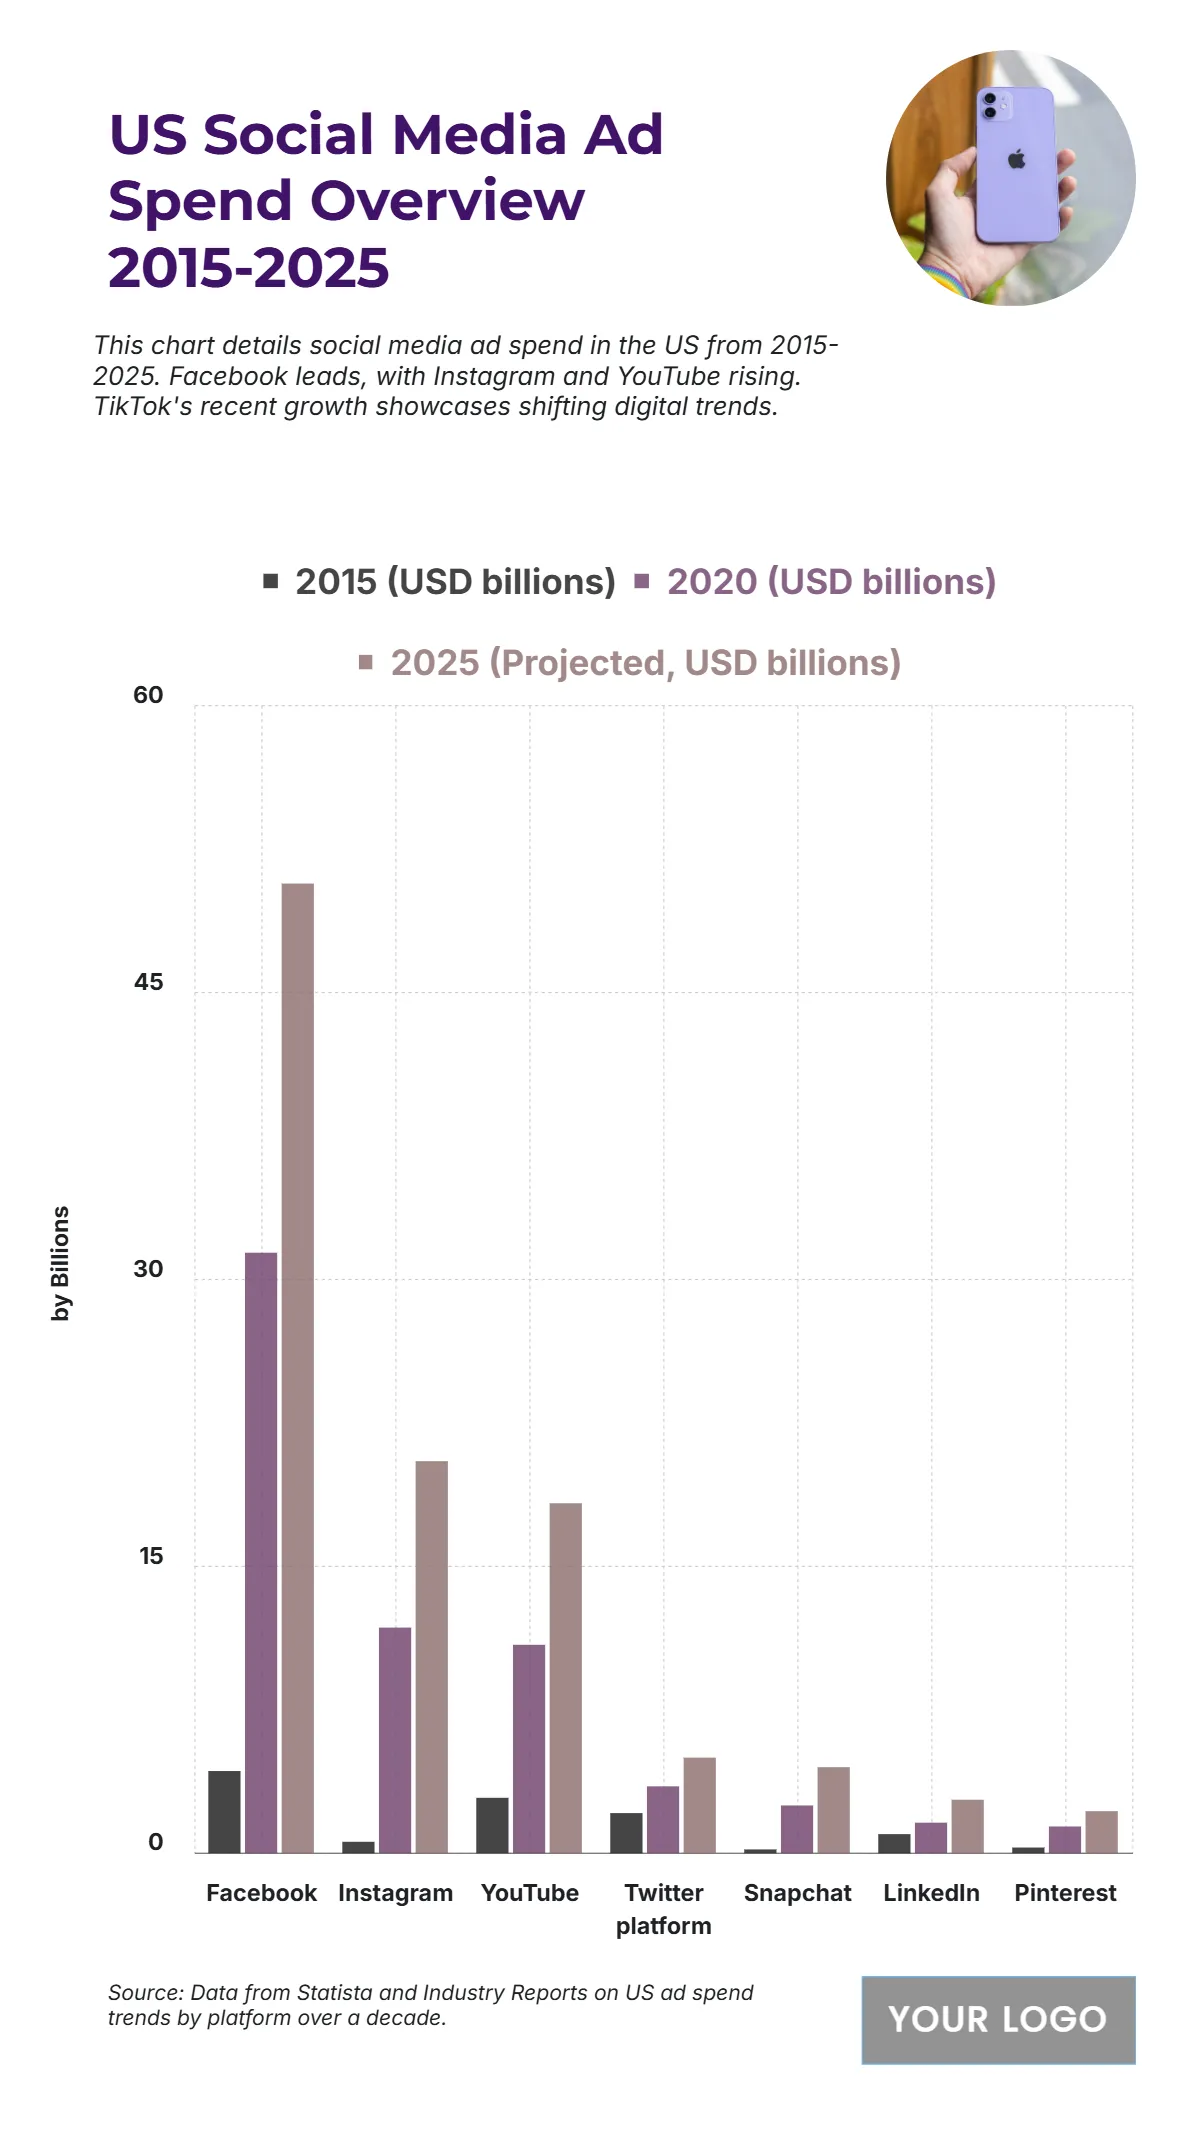
Free US Social Media Ad Spending by Platform from 2015 to 2025 Chart
The chart shows the sharp growth in US Social Media Ad Spend from 2015 to 2025, highlighting major digital platforms’ expanding influence. Facebook leads consistently, rising from USD 4.3 billion in 2015 to USD 31.4 billion in 2020, and is projected to hit USD 50.7 billion by 2025. Instagram follows a strong trajectory, growing from USD 0.6 billion in 2015 to USD 11.8 billion in 2020, and expected to reach USD 20.5 billion by 2025, fueled by influencer and video-driven content. YouTube shows steady gains, moving from USD 2.9 billion to USD 10.9 billion and then USD 18.3 billion. Meanwhile, Twitter climbs modestly from USD 2.1 billion to USD 5 billion, and Snapchat grows from USD 0.2 billion to USD 4.5 billion, showing strong youth appeal. LinkedIn and Pinterest grow gradually to USD 2.8 billion and USD 2.2 billion respectively by 2025, reflecting niche but steady advertiser investment.
| Labels | 2015 (USD billions) | 2020 (USD billions) | 2025 (Projected, USD billions) |
|---|---|---|---|
| 4.3 | 31.4 | 50.7 | |
| 0.6 | 11.8 | 20.5 | |
| YouTube | 2.9 | 10.9 | 18.3 |
| 2.1 | 3.5 | 5 | |
| Snapchat | 0.2 | 2.5 | 4.5 |
| 1 | 1.8 | 2.8 | |
| 0.3 | 1.4 | 2.2 |


