Free US Online Advertising Growth Trends from 2020 to 2025 Chart
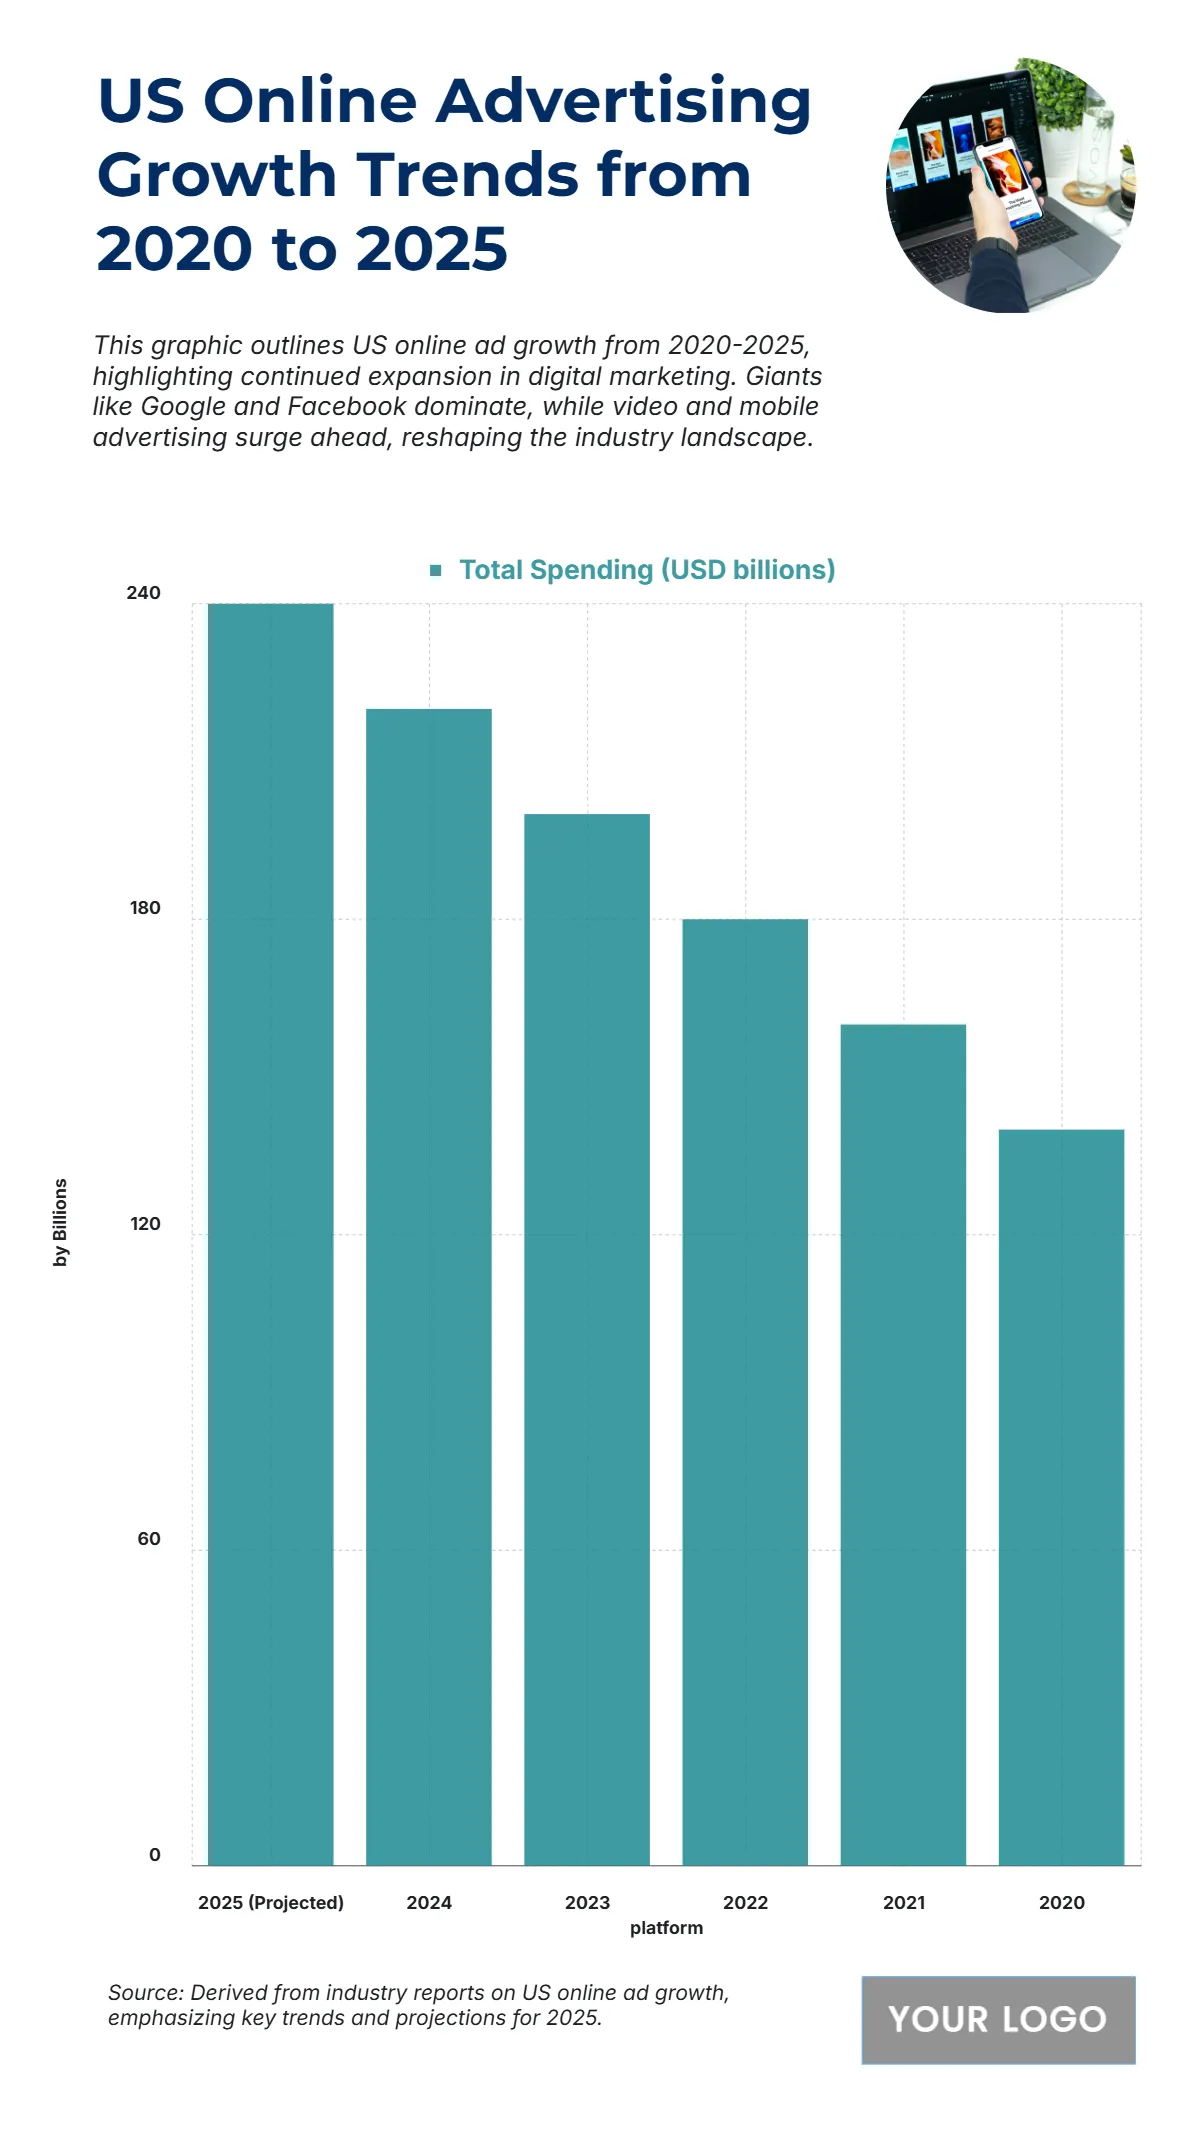
The chart illustrates the upward trajectory of US Online Advertising Growth from 2020 to 2025, highlighting the strong momentum of digital spending in the marketing industry. In 2020, total online ad spending was USD 140 billion, marking the start of a rapid expansion driven by e-commerce, video content, and mobile ads. The figure rose to USD 160 billion in 2021, followed by USD 180 billion in 2022, reflecting consistent year-over-year growth. By 2023, the spending reached USD 200 billion, fueled by increased social media usage and AI-driven ad strategies. In 2024, it surged to USD 220 billion, and projections for 2025 show a peak of USD 240 billion, demonstrating how online platforms like Google, Facebook, and YouTube continue to dominate the advertising landscape. This steady climb emphasizes the digital shift in brand marketing strategies across industries.
| Labels | Total Spending (USD billions) |
|---|---|
| 2025 (Projected) | 240 |
| 2024 | 220 |
| 2023 | 200 |
| 2022 | 180 |
| 2021 | 160 |
| 2020 | 140 |


