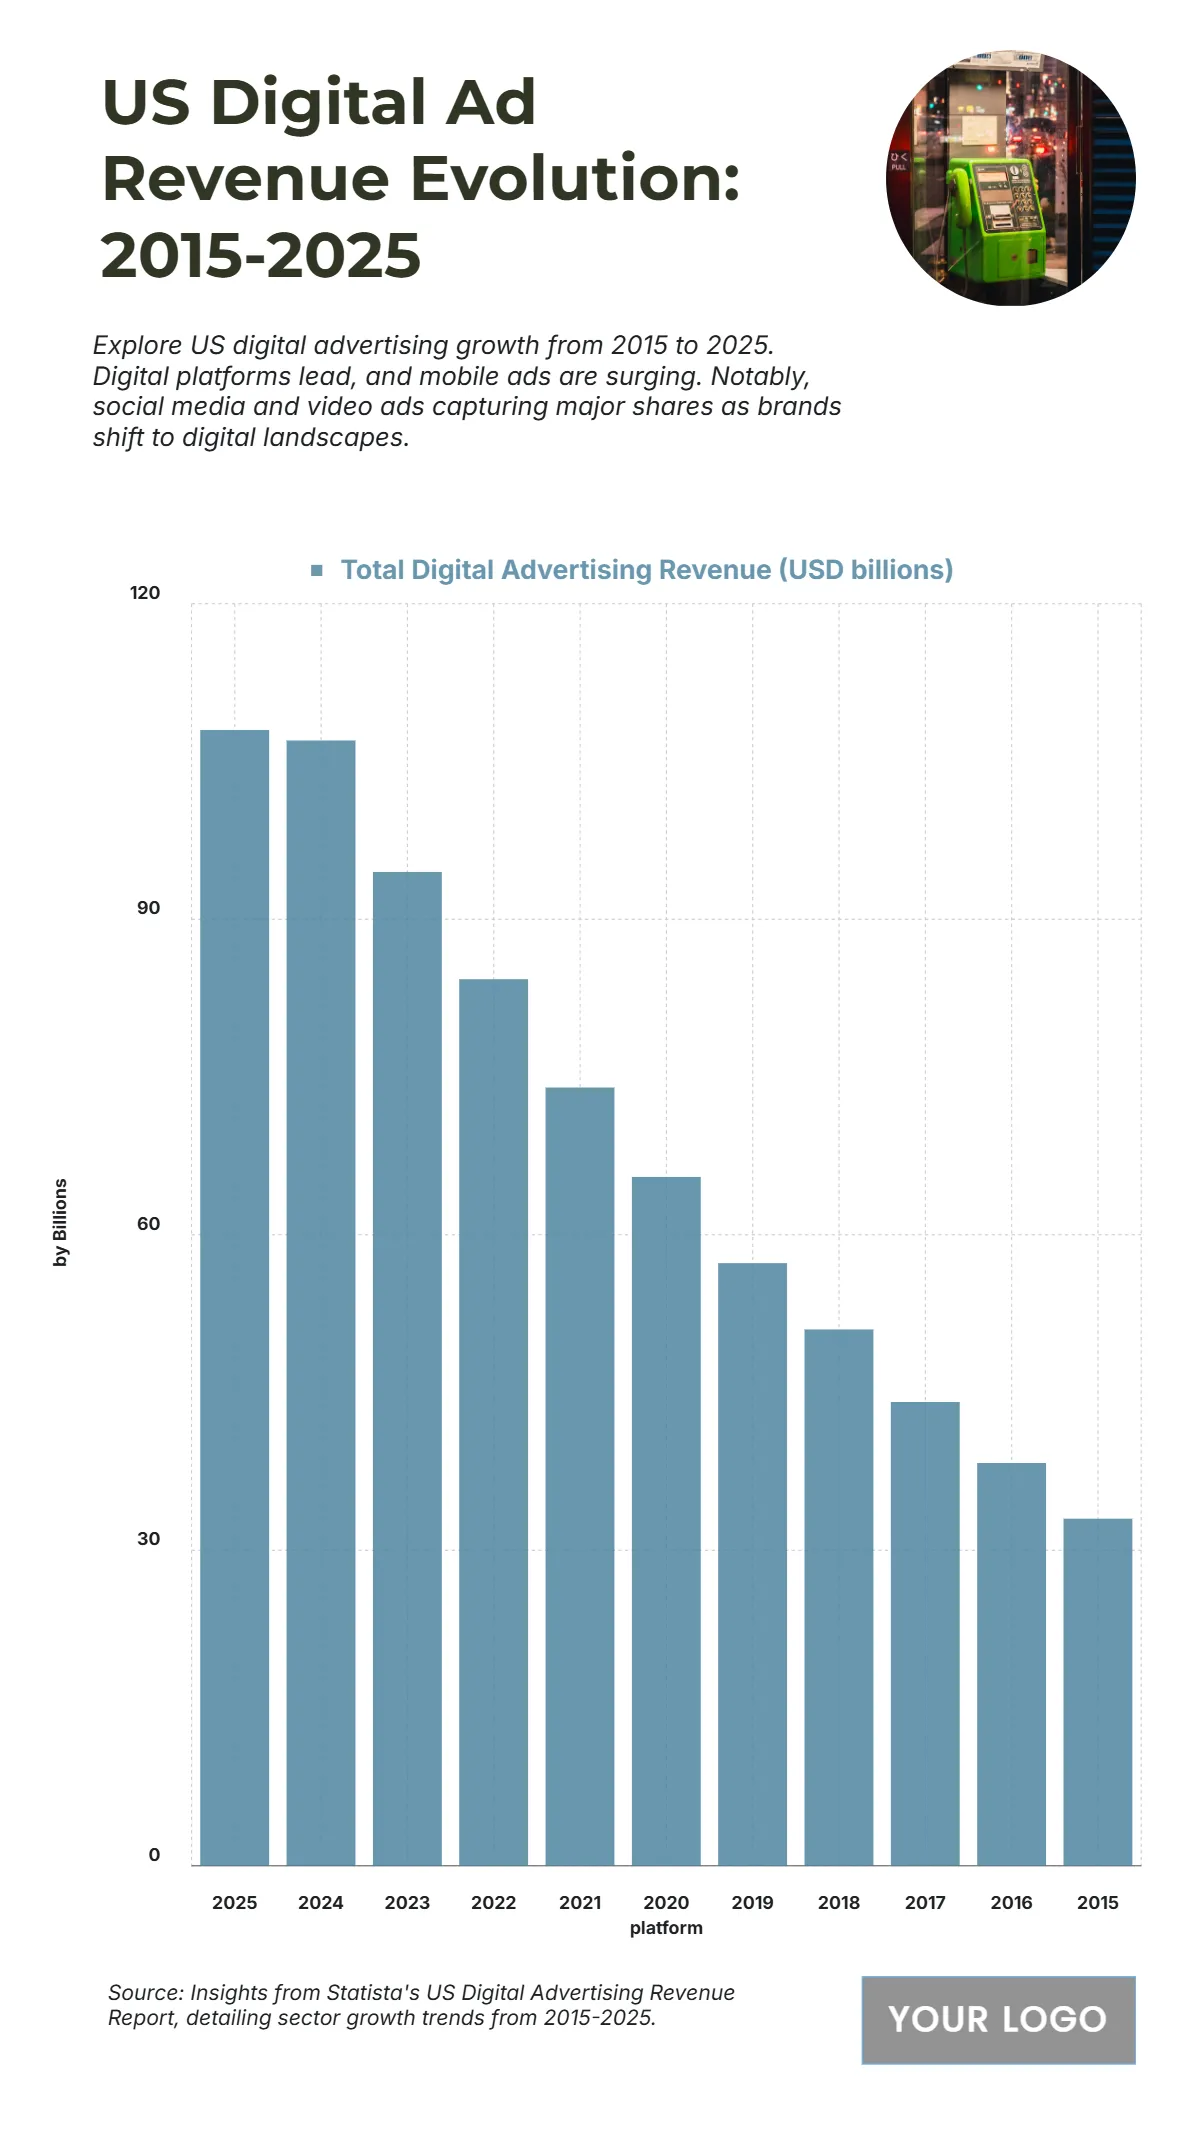
Free US Digital Advertising Revenue Trends from 2015 to 2025 Chart
The chart presents a clear upward trend in US Digital Ad Revenue between 2015 and 2025, highlighting the growing dominance of digital advertising in the marketing industry. Revenue began at USD 33 billion in 2015, gradually increasing to USD 38.3 billion in 2016 and USD 44.1 billion in 2017 as digital adoption gained traction. By 2018, revenue reached USD 51 billion, climbing to USD 57.3 billion in 2019 and USD 65.5 billion in 2020, fueled by mobile and video ad expansions. Growth continued through 2021 at USD 74 billion and USD 84.3 billion in 2022, reflecting steady digital transformation across industries. By 2023, revenue reached USD 94.5 billion, followed by USD 107 billion in 2024, and is projected to peak at USD 108 billion in 2025, marking a 227% increase over the decade. This sustained rise underscores digital media’s central role in future advertising strategies.
| Labels | Total Digital Advertising Revenue (USD billions) |
|---|---|
| 2025 | 108 |
| 2024 | 107 |
| 2023 | 94.5 |
| 2022 | 84.3 |
| 2021 | 74 |
| 2020 | 65.5 |
| 2019 | 57.3 |
| 2018 | 51 |
| 2017 | 44.1 |
| 2016 | 38.3 |
| 2015 | 33 |


