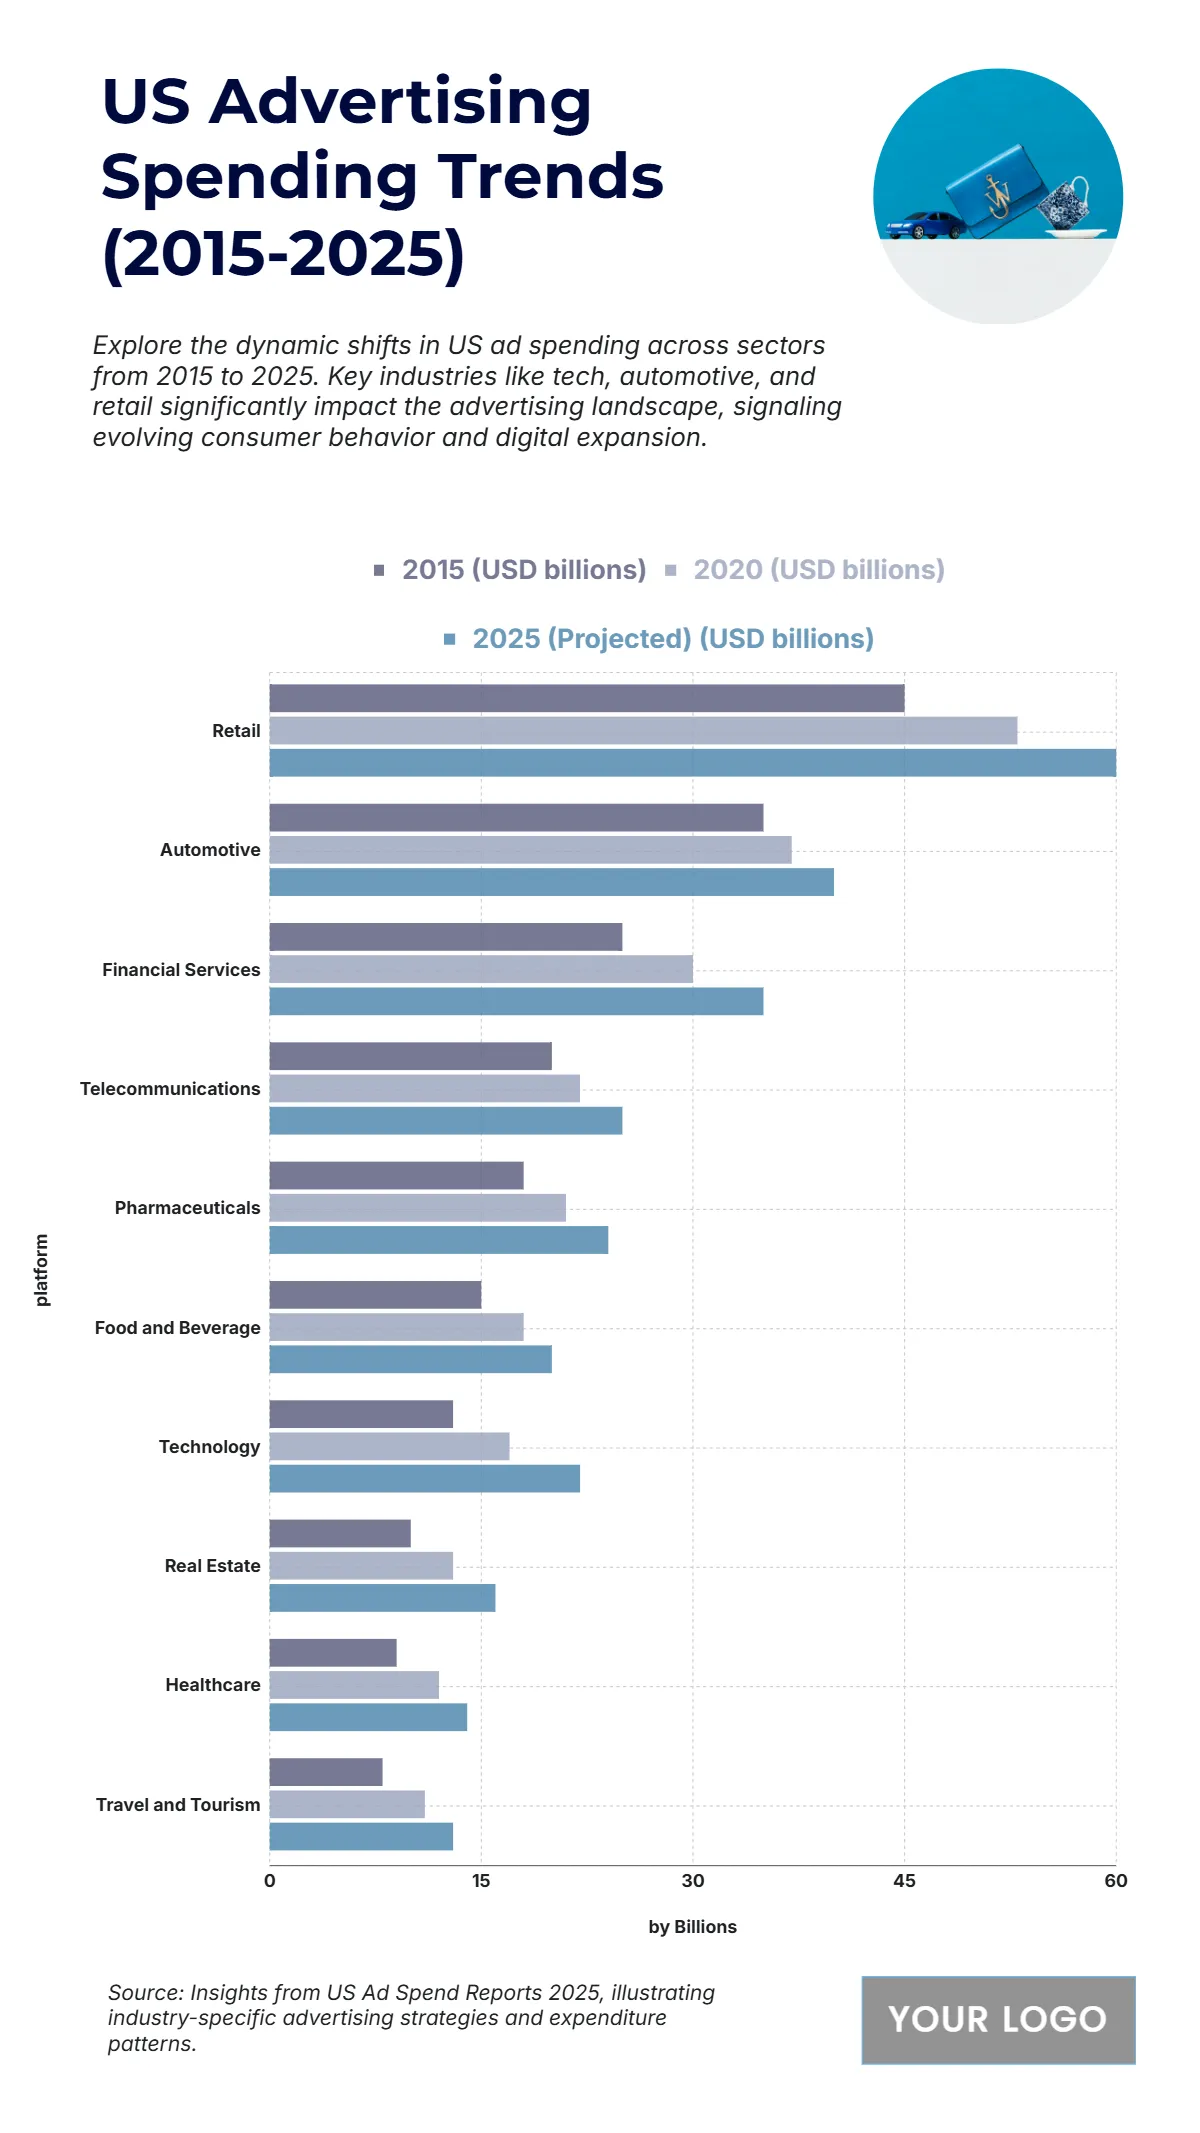
Free US Advertising Spending by Industry Sector from 2015 to 2025 Chart
The chart highlights steady growth across key US advertising sectors from 2015 to 2025, showing strong industry expansion driven by digital transformation. Retail remains the largest segment, increasing from USD 45 billion in 2015 to USD 53 billion in 2020, and projected to reach USD 60 billion by 2025. The automotive sector follows closely, growing from USD 35 billion to USD 40 billion over the same period, reflecting consistent brand investment. Financial services rise from USD 25 billion to USD 35 billion, while telecommunications expand from USD 20 billion to USD 25 billion. Pharmaceuticals show a notable climb from USD 18 billion to USD 24 billion, driven by health awareness and digital outreach. Technology advertising surges from USD 13 billion to USD 22 billion, the highest growth rate among emerging sectors. Meanwhile, healthcare and travel and tourism reach USD 14 billion and USD 13 billion, respectively, reflecting diversified ad spending across industries.
| Labels | 2015 (USD billions) | 2020 (USD billions) | 2025 (Projected, USD billions) |
|---|---|---|---|
| Retail | 45 | 53 | 60 |
| Automotive | 35 | 37 | 40 |
| Financial Services | 25 | 30 | 35 |
| Telecommunications | 20 | 22 | 25 |
| Pharmaceuticals | 18 | 21 | 24 |
| Food and Beverage | 15 | 18 | 20 |
| Technology | 13 | 17 | 22 |
| Real Estate | 10 | 13 | 16 |
| Healthcare | 9 | 12 | 14 |
| Travel and Tourism | 8 | 11 | 13 |


