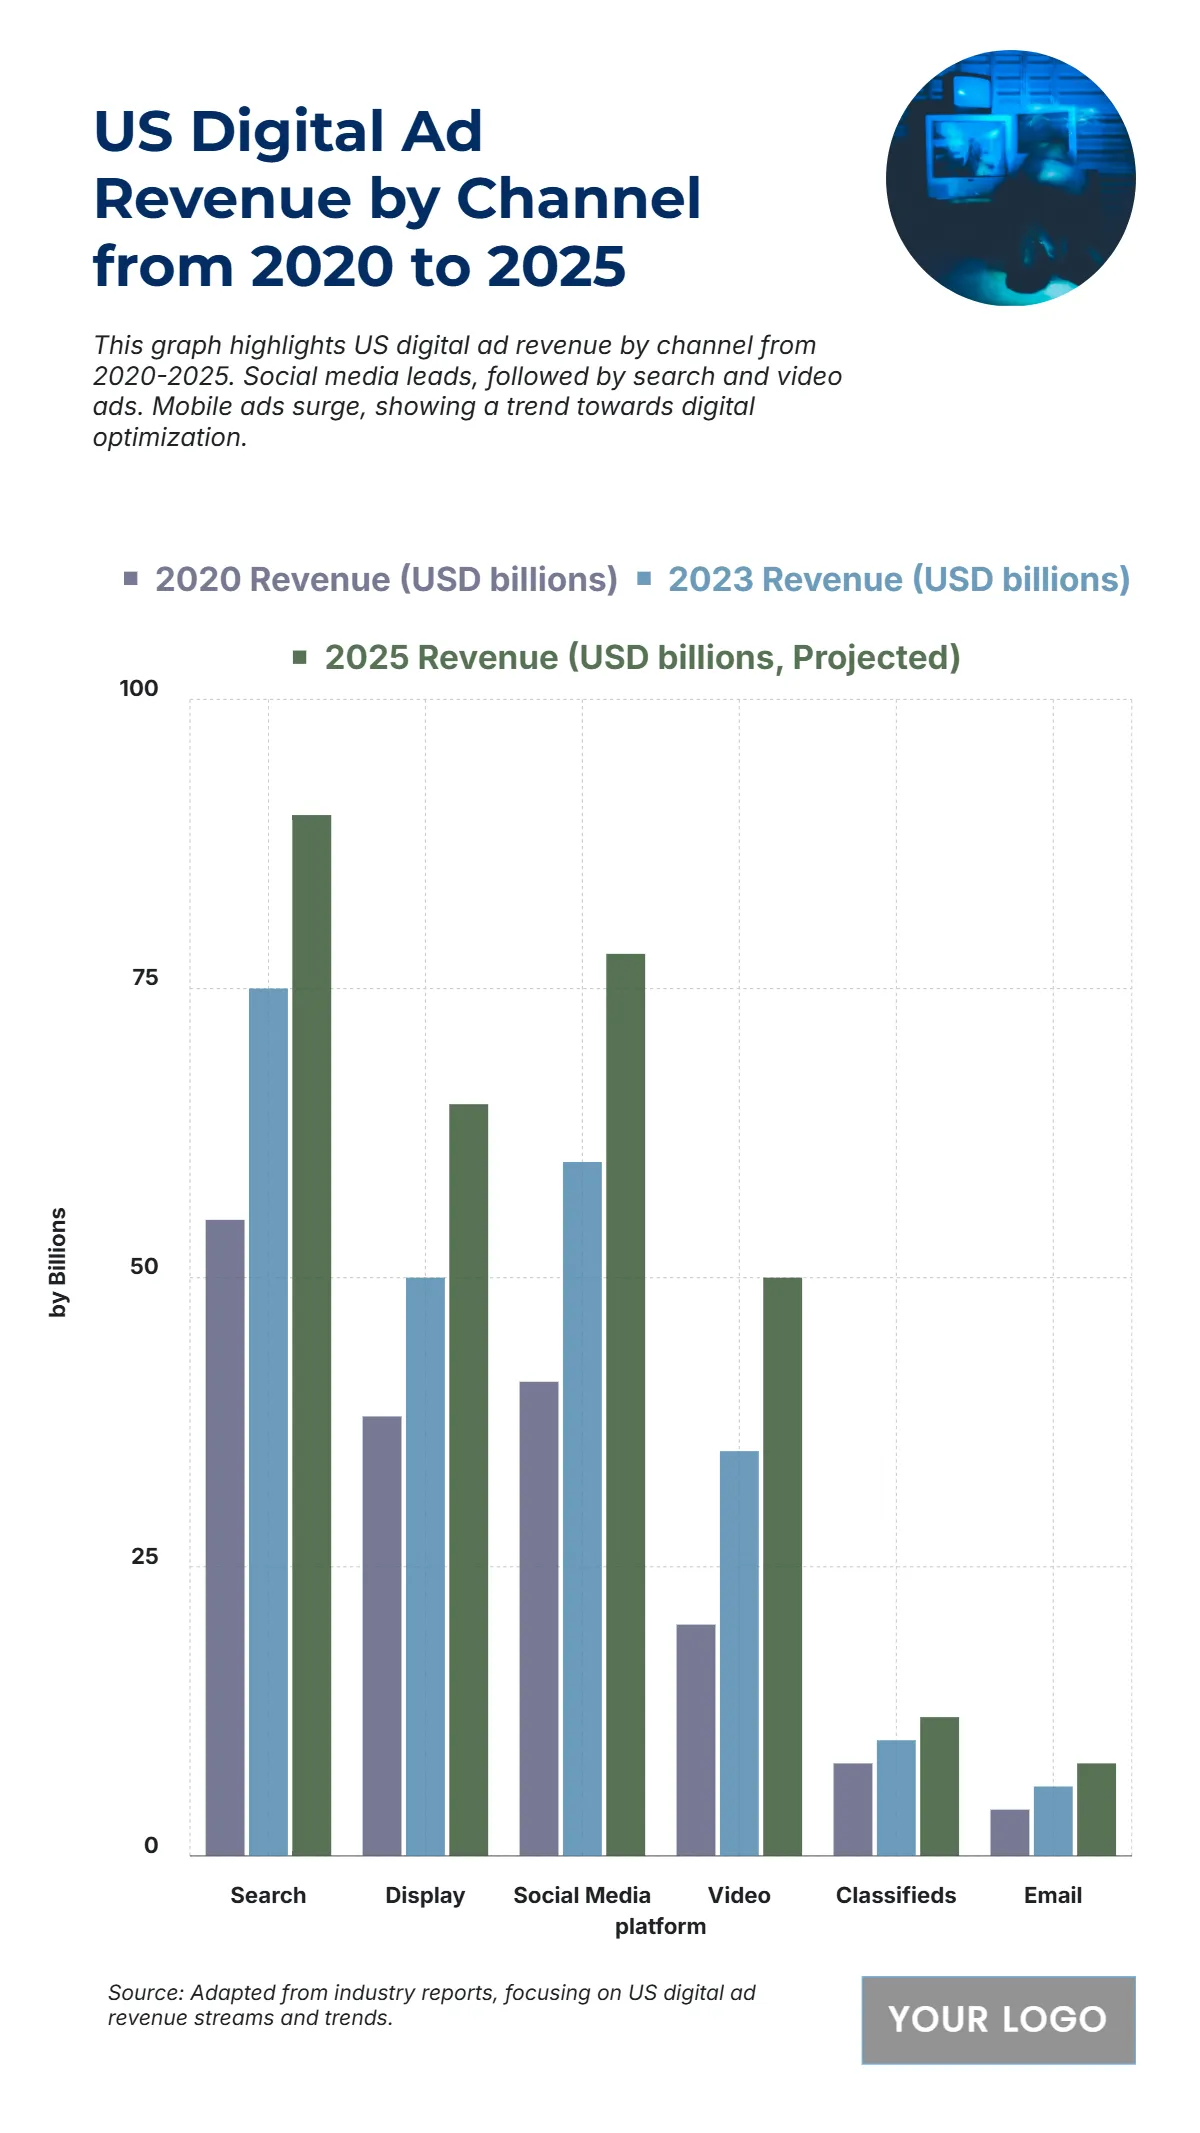
Free US Digital Ad Revenue by Channel from 2020 to 2025 Chart
The chart presents the growth of US Digital Ad Revenue by Channel from 2020 to 2025, revealing the steady expansion across major digital platforms. Search advertising leads the category, increasing from USD 55 billion in 2020 to USD 75 billion in 2023, with a projected USD 90 billion by 2025, underscoring its continued dominance. Social Media follows closely, rising from USD 41 billion to USD 60 billion, and is expected to reach USD 78 billion, reflecting the strong influence of social-driven marketing. Display advertising grows from USD 38 billion to USD 50 billion, projected at USD 65 billion by 2025, fueled by visual ad innovations. Video ads also show rapid growth, doubling from USD 20 billion in 2020 to USD 50 billion by 2025. Meanwhile, Classifieds and Email marketing maintain steady yet smaller contributions, increasing to USD 12 billion and USD 8 billion, respectively.
| Labels | 2020 Revenue (USD billions) | 2023 Revenue (USD billions) | 2025 Revenue (USD billions, Projected) |
|---|---|---|---|
| Search | 55 | 75 | 90 |
| Display | 38 | 50 | 65 |
| Social Media | 41 | 60 | 78 |
| Video | 20 | 35 | 50 |
| Classifieds | 8 | 10 | 12 |
| 4 | 6 | 8 |


