Free US Online Video Ad Growth by Year from 2015 to 2025 Chart
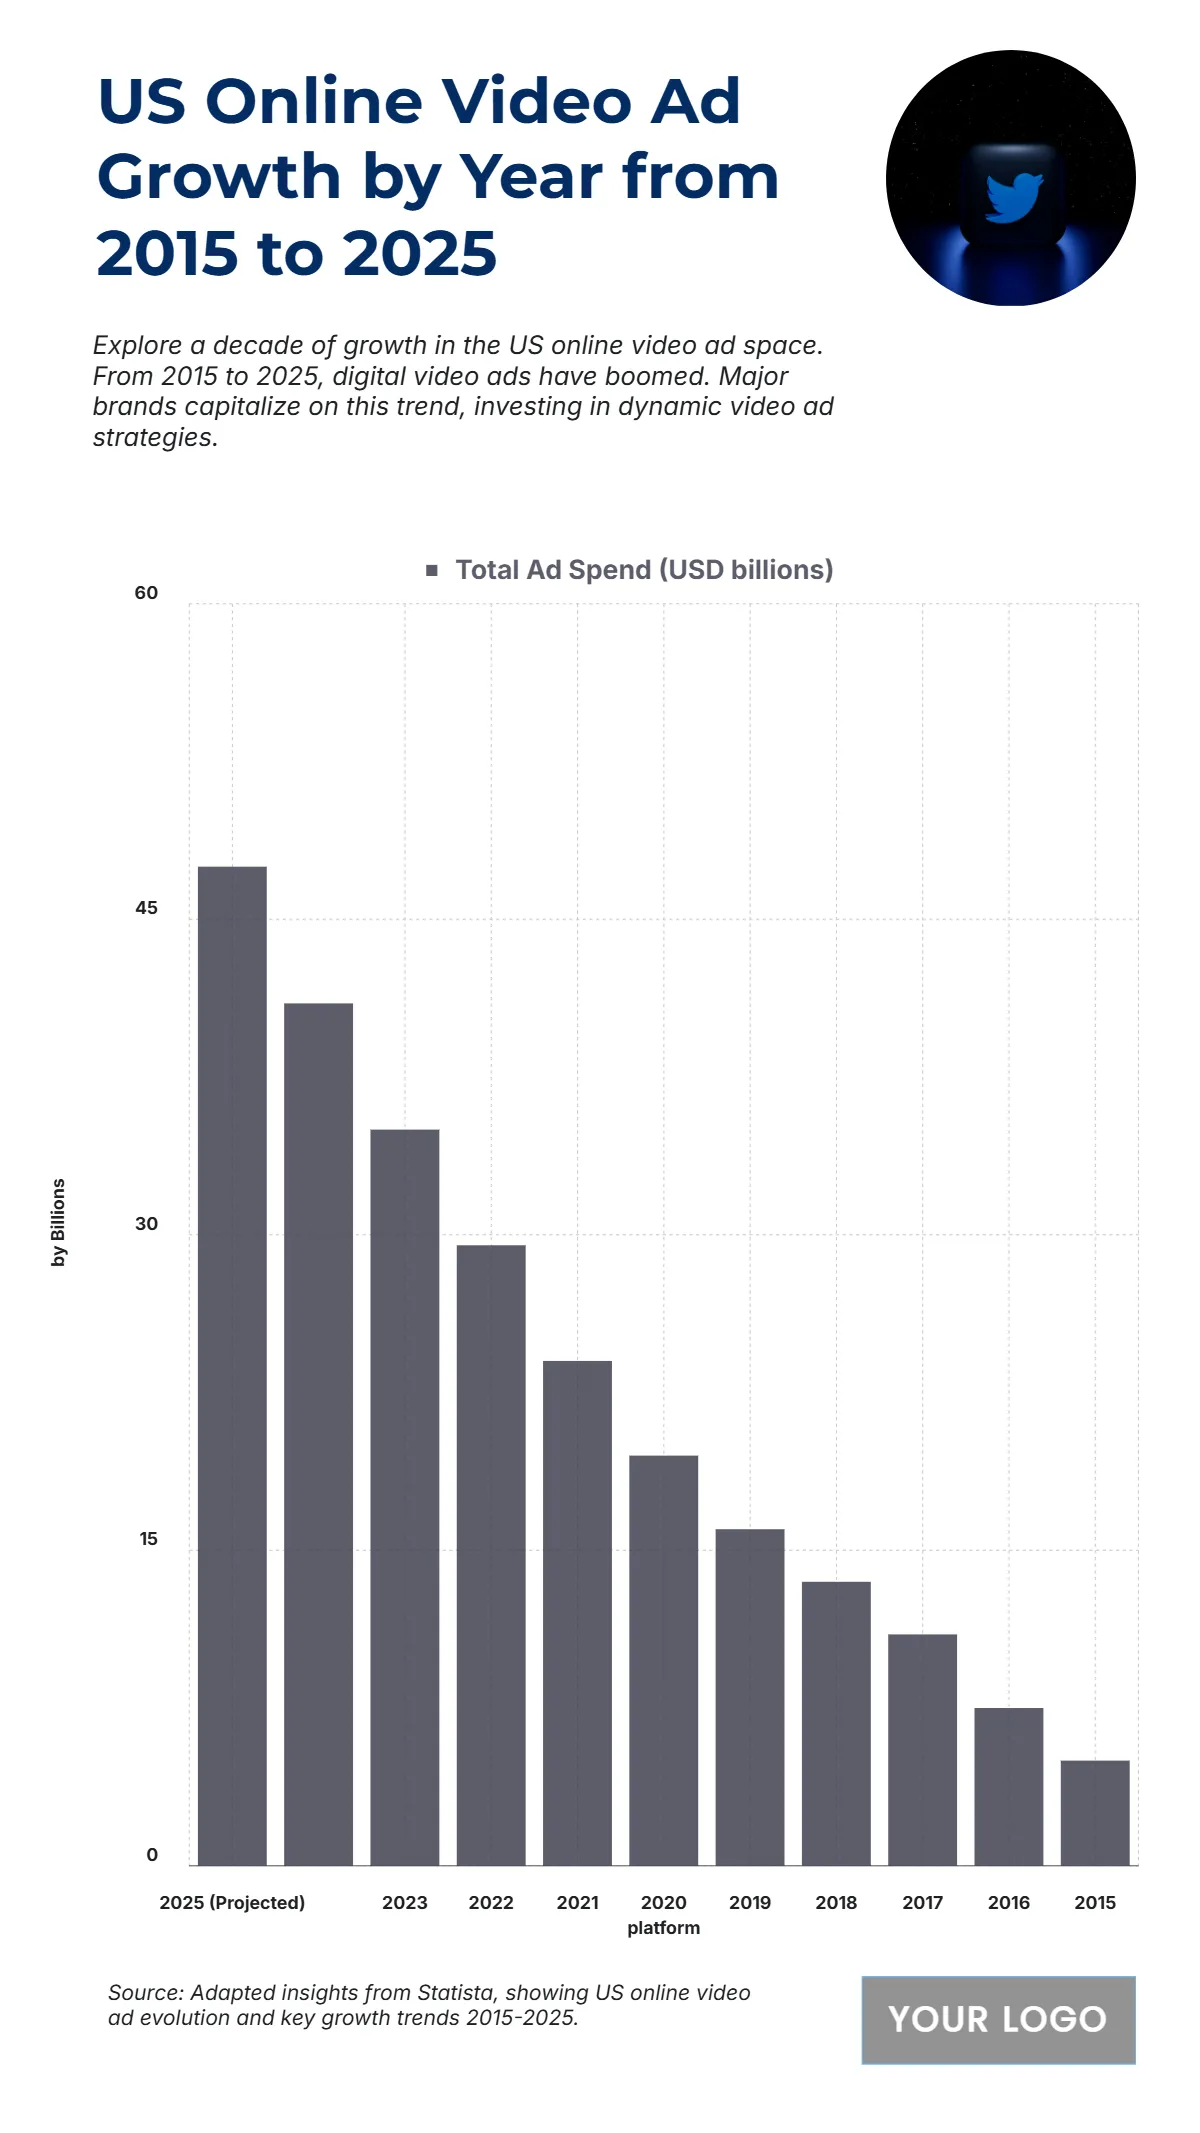
The chart illustrates the consistent rise in US Online Video Ad Growth from 2015 to 2025, emphasizing the growing dominance of digital video advertising in marketing strategies. In 2015, ad spending was USD 5 billion, marking the early stage of adoption. The figure rose to USD 7.5 billion in 2016 and USD 11 billion in 2017, reflecting increased investment in video-based engagement. By 2018, spending reached USD 13.5 billion, followed by USD 16 billion in 2019 and USD 19.5 billion in 2020, as video content became a central medium for brands. Continued growth pushed totals to USD 24 billion in 2021, USD 29.5 billion in 2022, and USD 35 billion in 2023. Projected figures show a further rise to USD 41 billion in 2024 and USD 47.5 billion by 2025, highlighting the long-term expansion of the digital video ad ecosystem.
| Labels | Total Ad Spend (USD billions) |
|---|---|
| 2025 (Projected) | 47.5 |
| 2024 (Projected) | 41 |
| 2023 | 35 |
| 2022 | 29.5 |
| 2021 | 24 |
| 2020 | 19.5 |
| 2019 | 16 |
| 2018 | 13.5 |
| 2017 | 11 |
| 2016 | 7.5 |
| 2015 | 5 |


