Free US Social Media Ad Revenue by Platform from 2015 to 2025 Chart
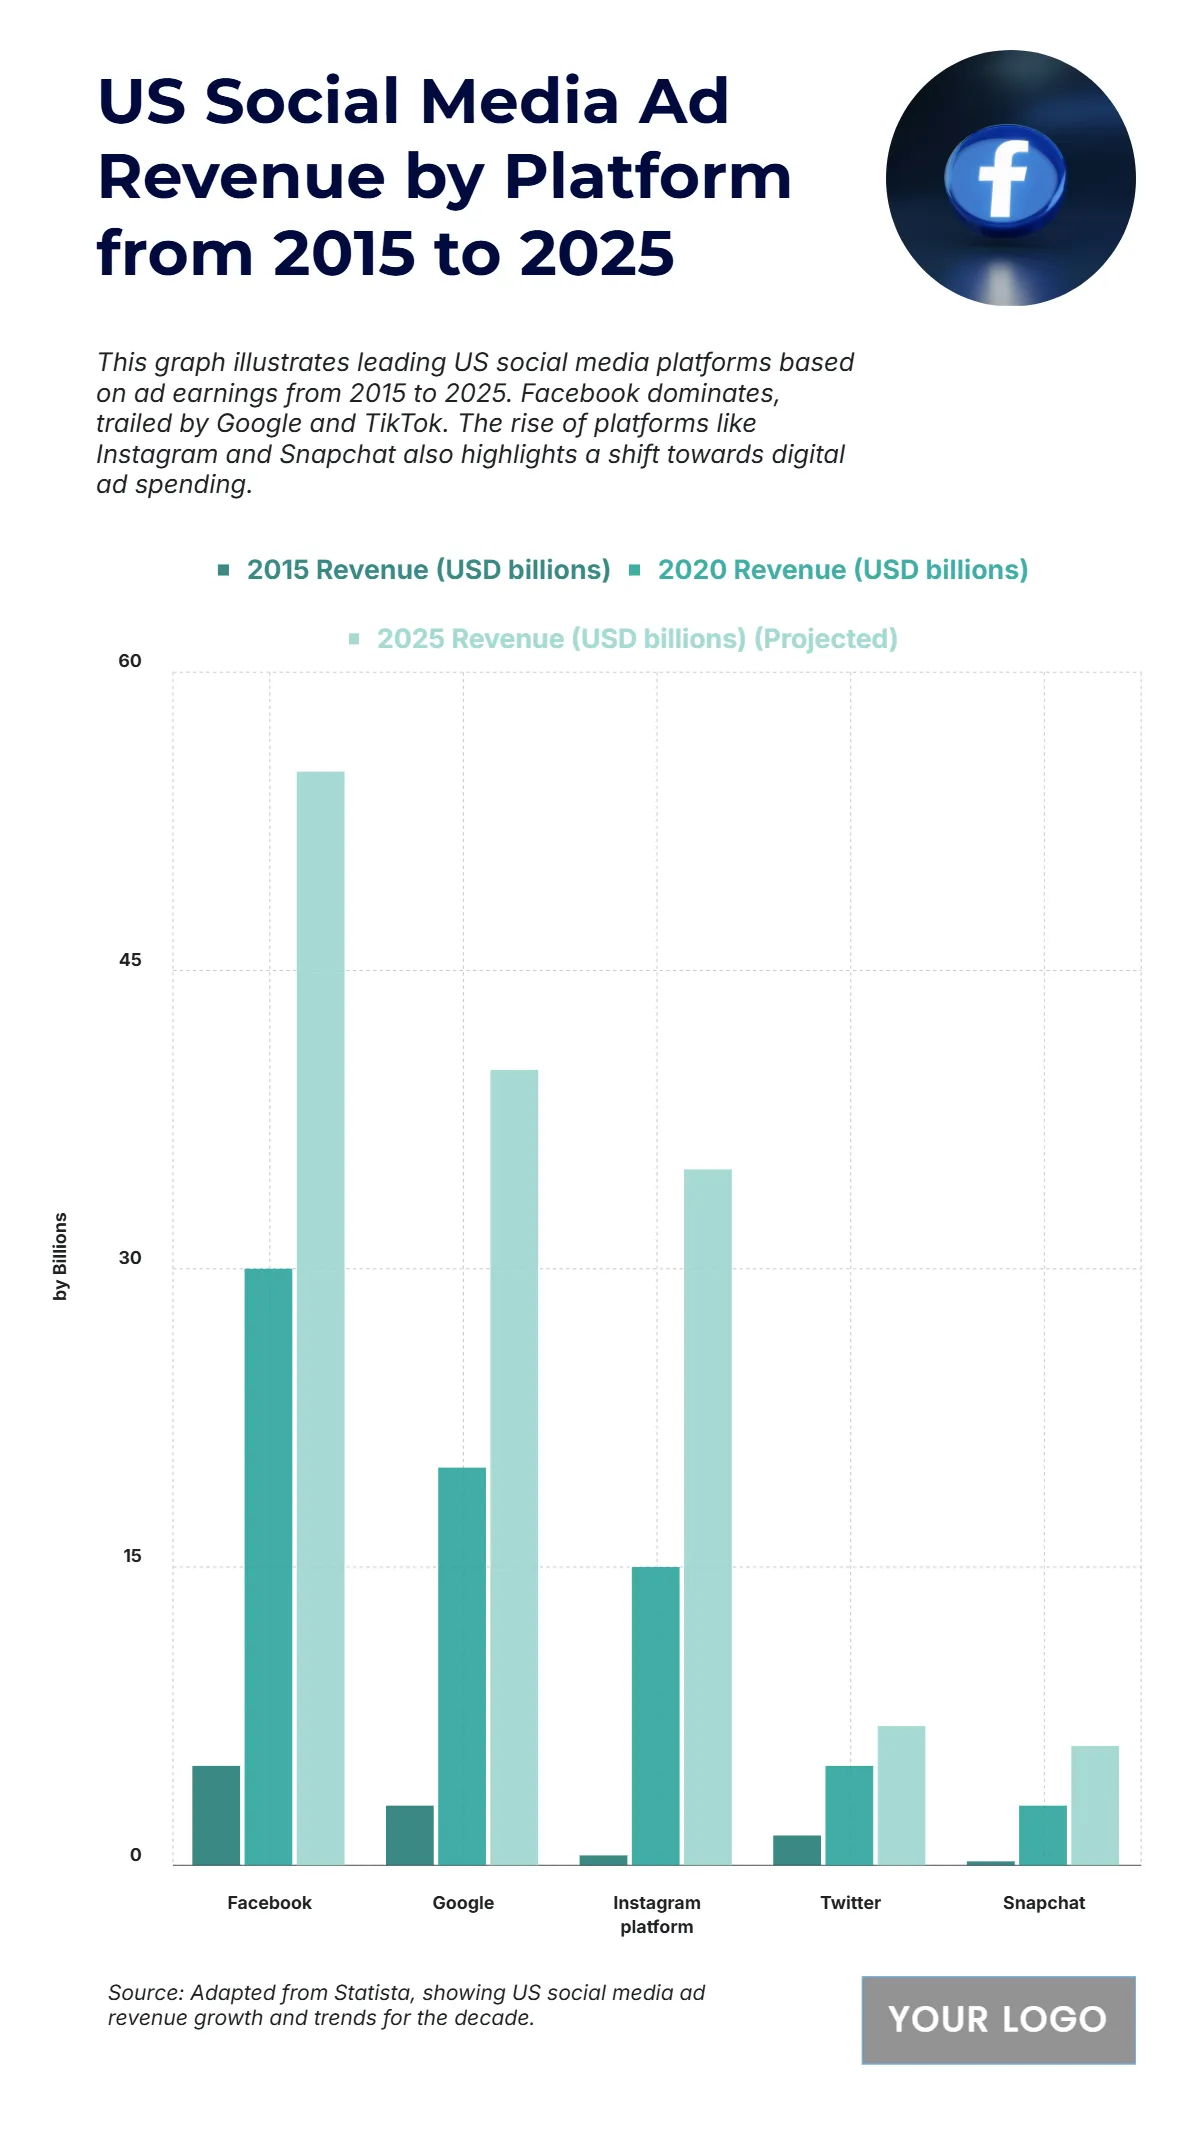
The chart shows the rapid increase in US Social Media Ad Revenue from 2015 to 2025, highlighting the dominance of major platforms in digital advertising. Facebook leads significantly, growing from USD 5 billion in 2015 to USD 30 billion in 2020, and is projected to reach USD 55 billion by 2025, maintaining its position as the top platform for advertisers. Google follows, rising from USD 3 billion to USD 20 billion, and projected to hit USD 40 billion, supported by YouTube’s video ad growth. Instagram shows remarkable expansion, from USD 0.5 billion in 2015 to USD 15 billion in 2020, and expected to climb to USD 35 billion by 2025, driven by influencer and story-based ads. Meanwhile, Twitter and Snapchat see steady gains, growing to USD 7 billion and USD 6 billion respectively by 2025, showing diverse yet competitive ad spending across platforms.
| Labels | 2015 Revenue (USD billions) | 2020 Revenue (USD billions) | 2025 Revenue (USD billions, Projected) |
|---|---|---|---|
| 5 | 30 | 55 | |
| 3 | 20 | 40 | |
| 0.5 | 15 | 35 | |
| 1.5 | 5 | 7 | |
| Snapchat | 0.2 | 3 | 6 |


