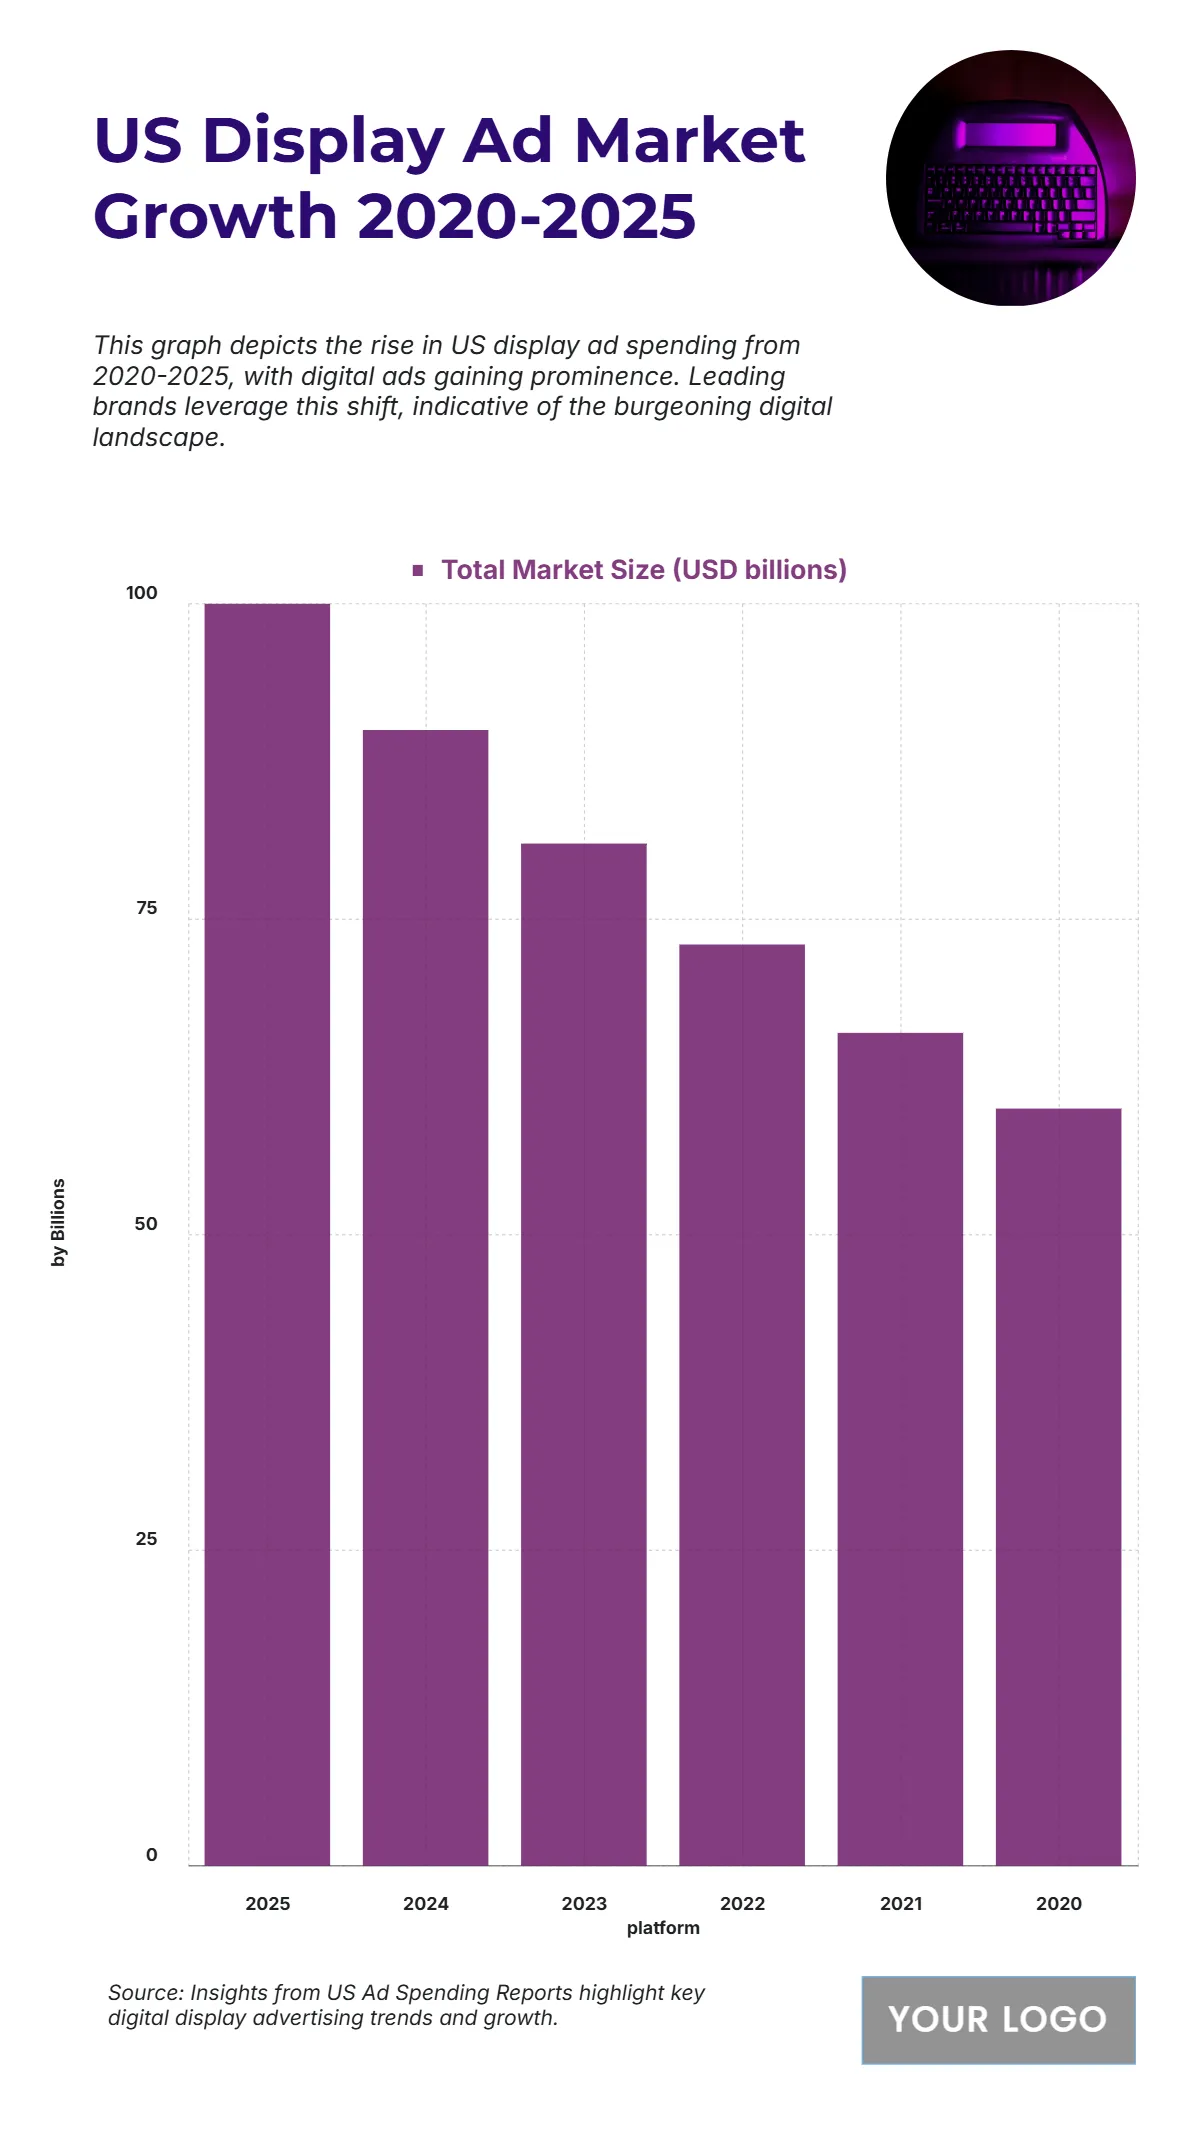
Free US Display Advertising Market Size from 2020 to 2025 Chart
The chart presents the continuous growth of the US Display Ad Market from 2020 to 2025, highlighting the rising importance of visual digital advertising across industries. In 2020, the total market size was USD 60 billion, marking the start of significant digital expansion. The following year, 2021, saw an increase to USD 66 billion, reflecting stronger brand investment in display networks and programmatic ads. By 2022, spending grew to USD 73 billion, driven by advanced ad targeting and rich media content. This momentum continued into 2023, reaching USD 81 billion, followed by USD 90 billion in 2024, as mobile and video display formats gained traction. Projections for 2025 estimate a peak of USD 100 billion, signifying a 66% increase over five years. The upward trend demonstrates how brands continue to rely on display advertising for visibility, engagement, and conversion in the evolving digital landscape.
| Labels | Total Market Size (USD billions) |
|---|---|
| 2025 | 100 |
| 2024 | 90 |
| 2023 | 81 |
| 2022 | 73 |
| 2021 | 66 |
| 2020 | 60 |


