Free US Search Advertising Revenue Growth from 2015 to 2025 Chart
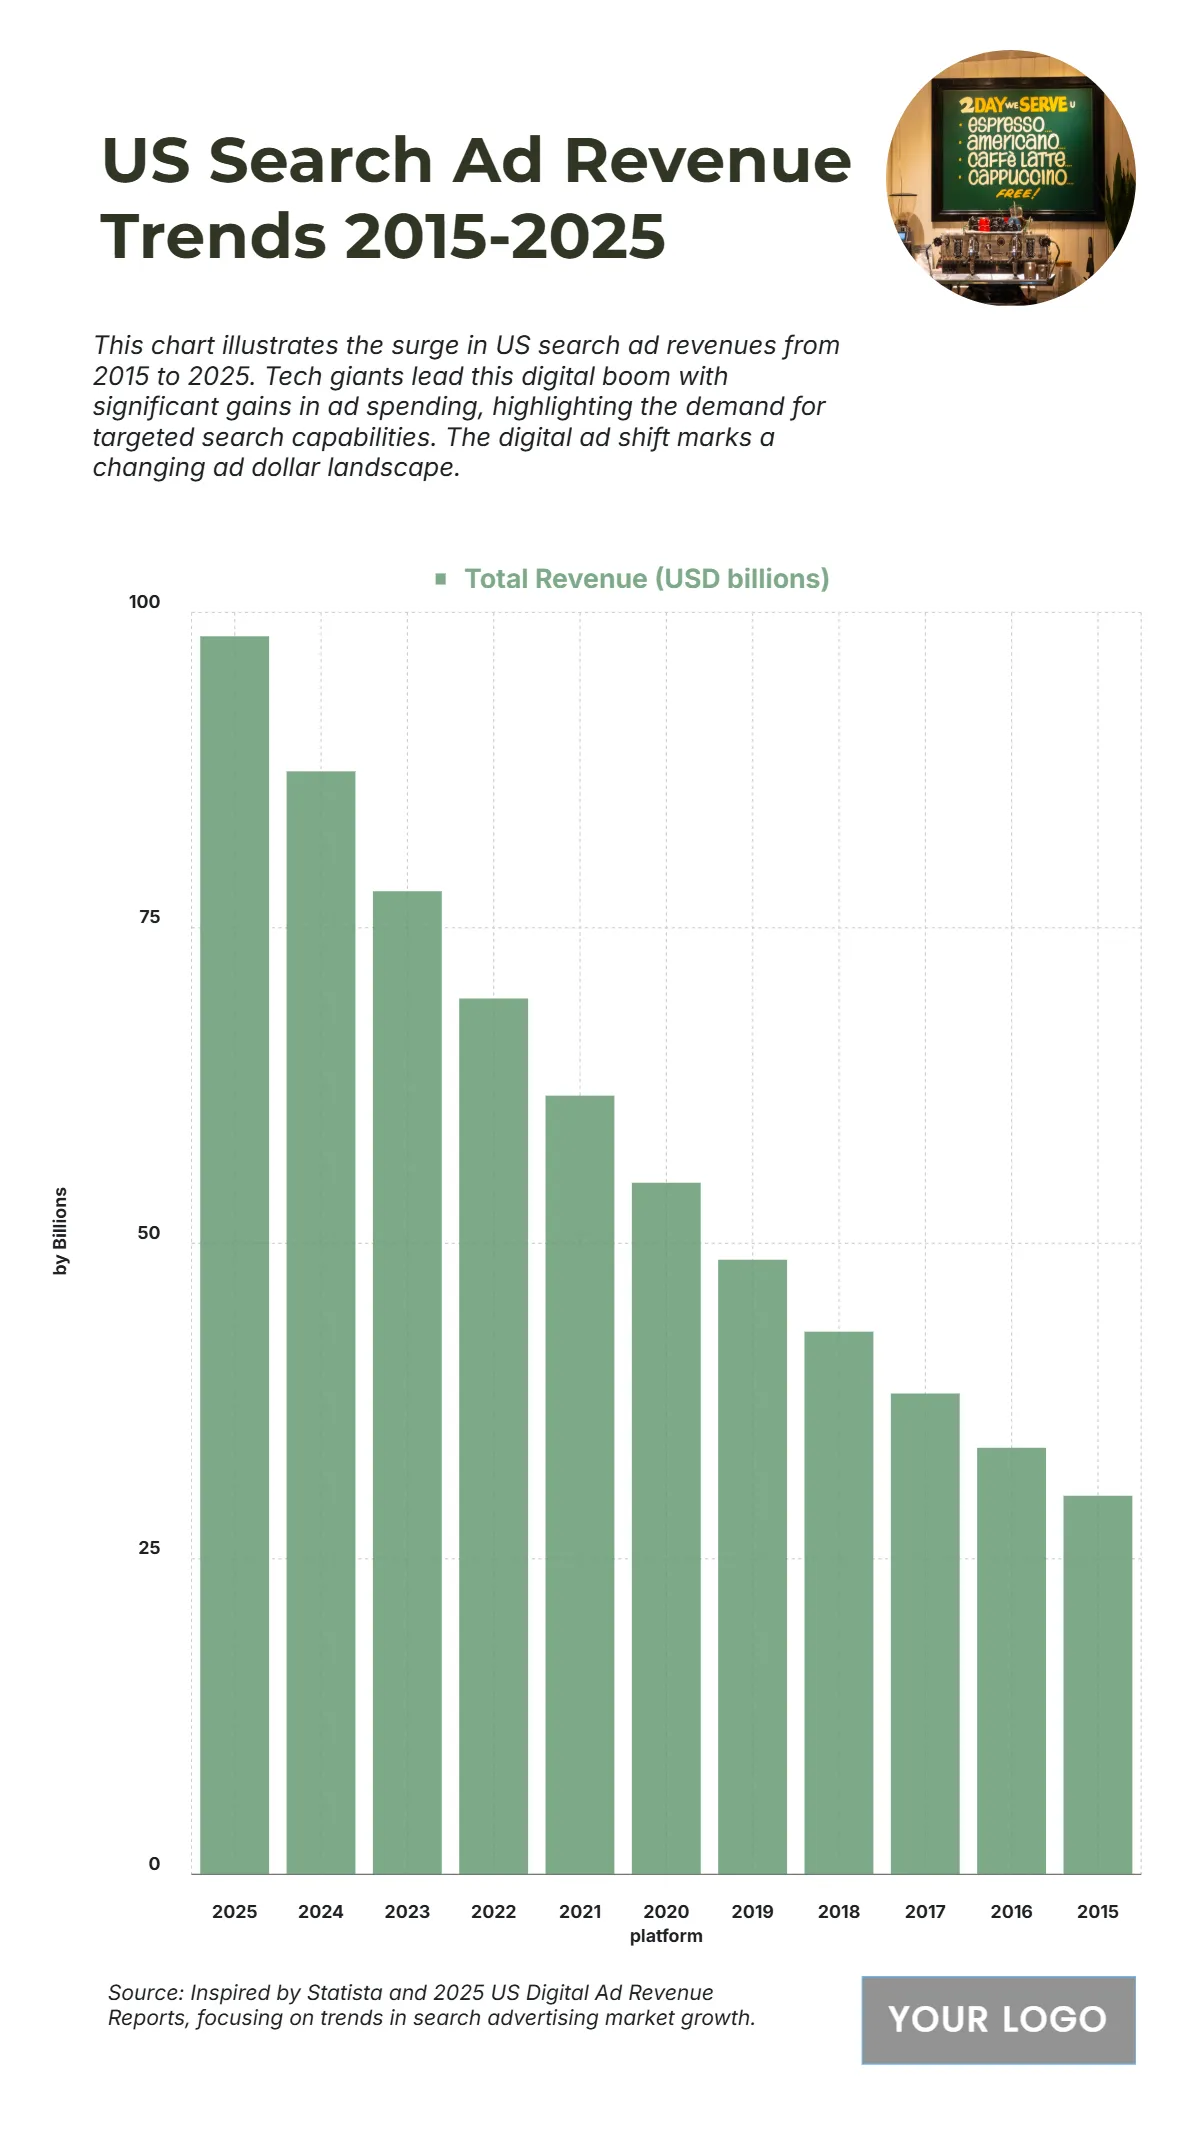
The chart highlights a remarkable increase in US Search Ad Revenue from 2015 to 2025, reflecting the growing influence of digital advertising and targeted search marketing. In 2015, total revenue was USD 30 billion, gradually rising to USD 33.8 billion in 2016 and USD 38.1 billion in 2017 as online search platforms gained traction. By 2018, revenue climbed to USD 43 billion and reached USD 48.7 billion in 2019, showcasing consistent year-over-year growth. The momentum accelerated with USD 54.8 billion in 2020 and USD 61.7 billion in 2021, fueled by increased advertiser reliance on digital campaigns. Continued expansion brought totals to USD 69.4 billion in 2022 and USD 77.9 billion in 2023. By 2024, revenue surged to USD 87.4 billion, before peaking at USD 98.1 billion in 2025, more than tripling the 2015 figure, signifying the sector’s dominance in modern advertising strategies.
| Labels | Total Revenue (USD billions) |
|---|---|
| 2025 | 98.1 |
| 2024 | 87.4 |
| 2023 | 77.9 |
| 2022 | 69.4 |
| 2021 | 61.7 |
| 2020 | 54.8 |
| 2019 | 48.7 |
| 2018 | 43 |
| 2017 | 38.1 |
| 2016 | 33.8 |
| 2015 | 30 |


