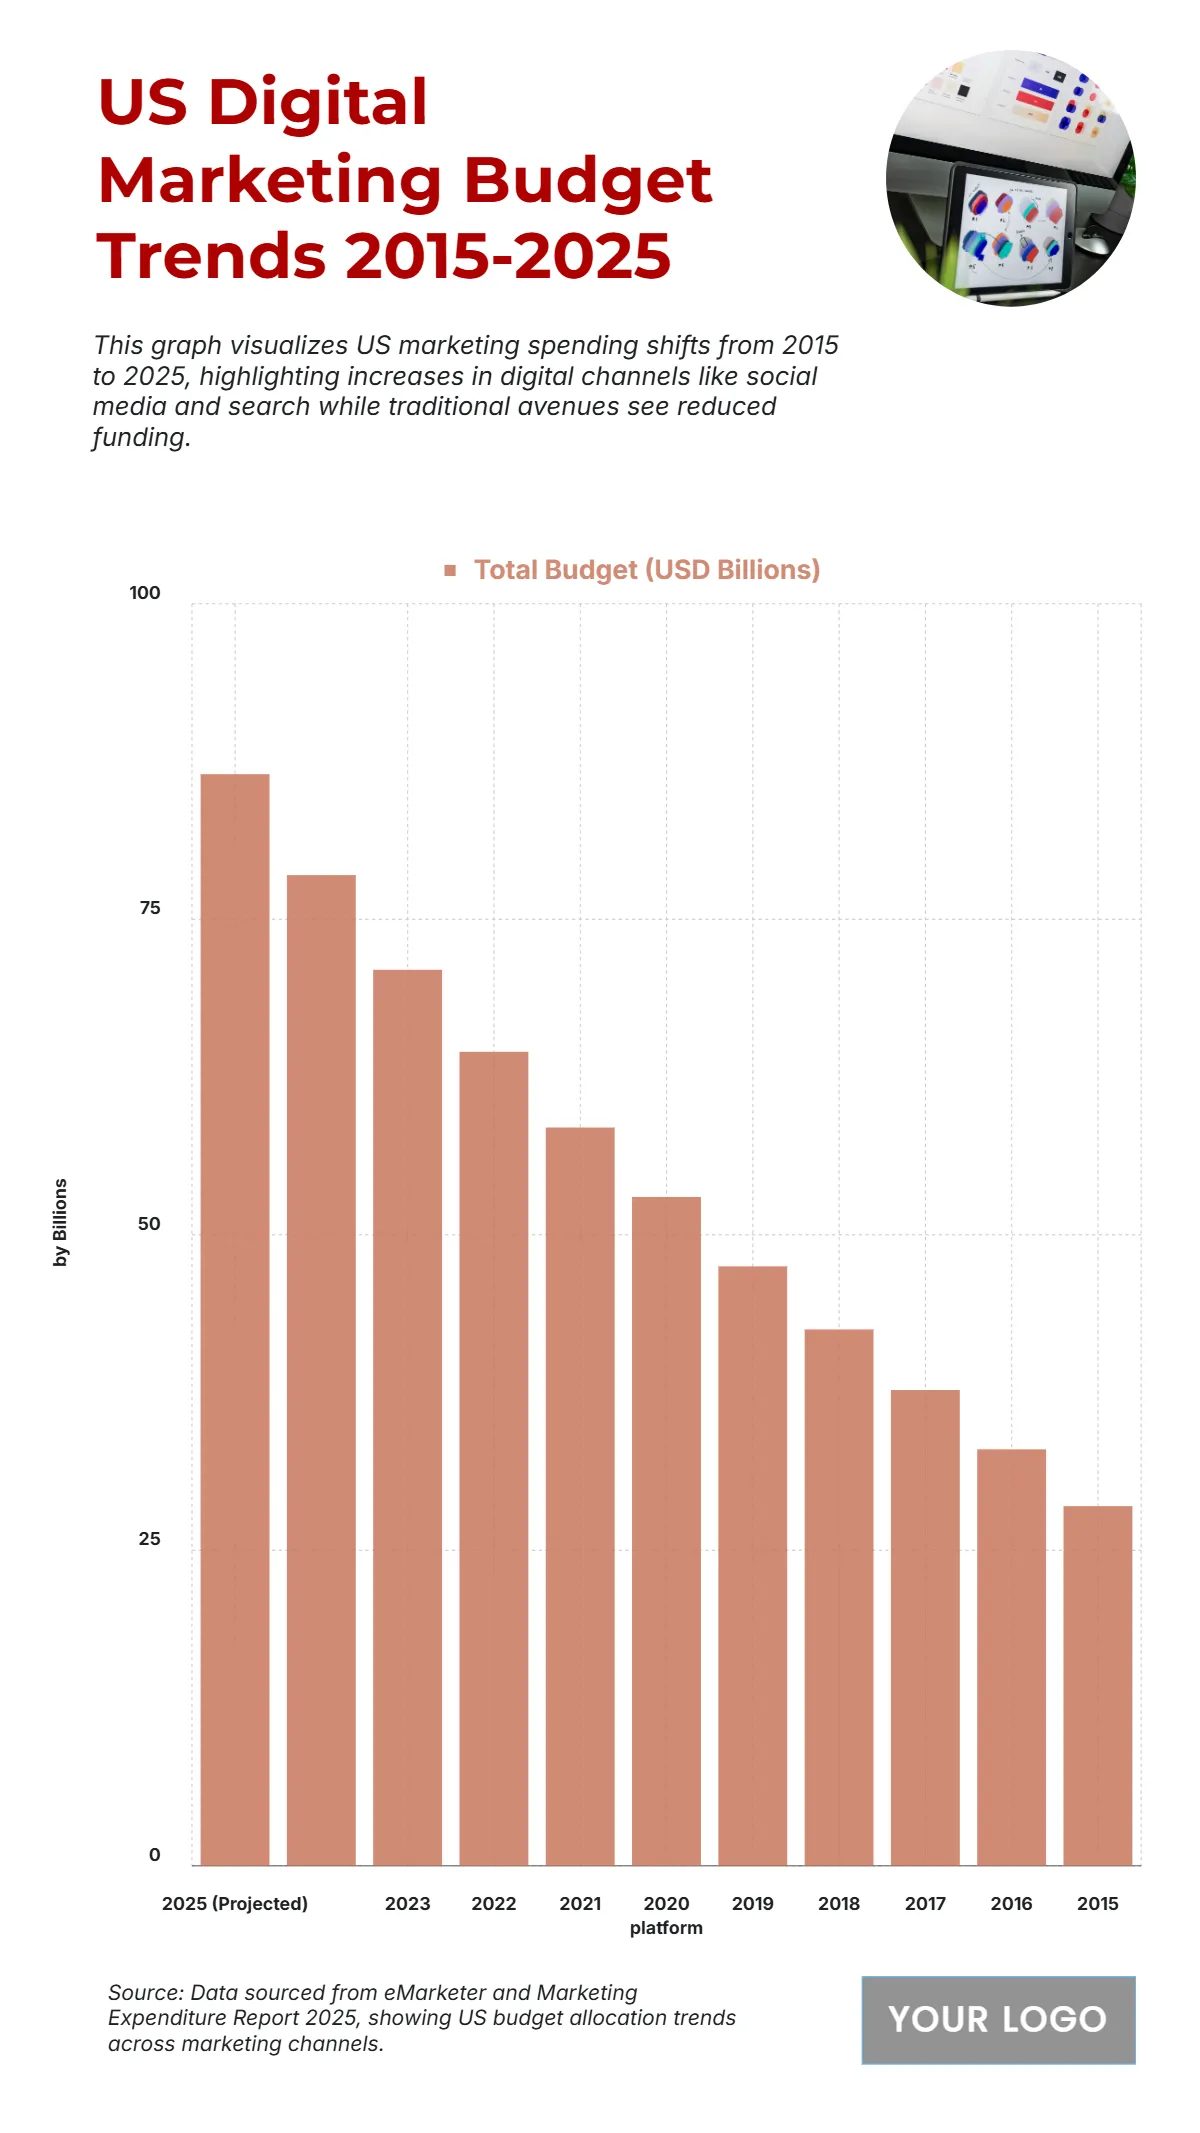
Free US Digital Marketing Budget Allocation by Channel from 2015 to 2025 Chart
The chart illustrates the continuous rise in US digital marketing budgets from 2015 to 2025, showing the expanding dominance of online platforms in the marketing landscape. In 2015, the total budget stood at approximately $30 billion, reflecting early adoption of digital strategies. Spending grew steadily, reaching $42 billion in 2018, $55 billion in 2020, and $67 billion in 2022, as businesses increasingly shifted from traditional media to online advertising. By 2024, allocations rose sharply to $80 billion, culminating in a projected $90 billion by 2025, marking a threefold increase over the decade. The consistent upward trend underscores the prioritization of digital channels such as social media, search, and content marketing, which now account for the majority of marketing investments. This growth trajectory highlights how digital transformation, data-driven campaigns, and consumer online behavior have redefined marketing expenditure strategies in the United States.
| Labels | Total Budget (USD Billions) |
|---|---|
| 2025 (Projected) | 86.5 |
| 2024 (Projected) | 78.5 |
| 2023 | 71 |
| 2022 | 64.5 |
| 2021 | 58.5 |
| 2020 | 53 |
| 2019 | 47.5 |
| 2018 | 42.5 |
| 2017 | 37.7 |
| 2016 | 33 |
| 2015 | 28.5 |


