Free US E-commerce Sales Growth by Category from 2020 to 2025 Chart
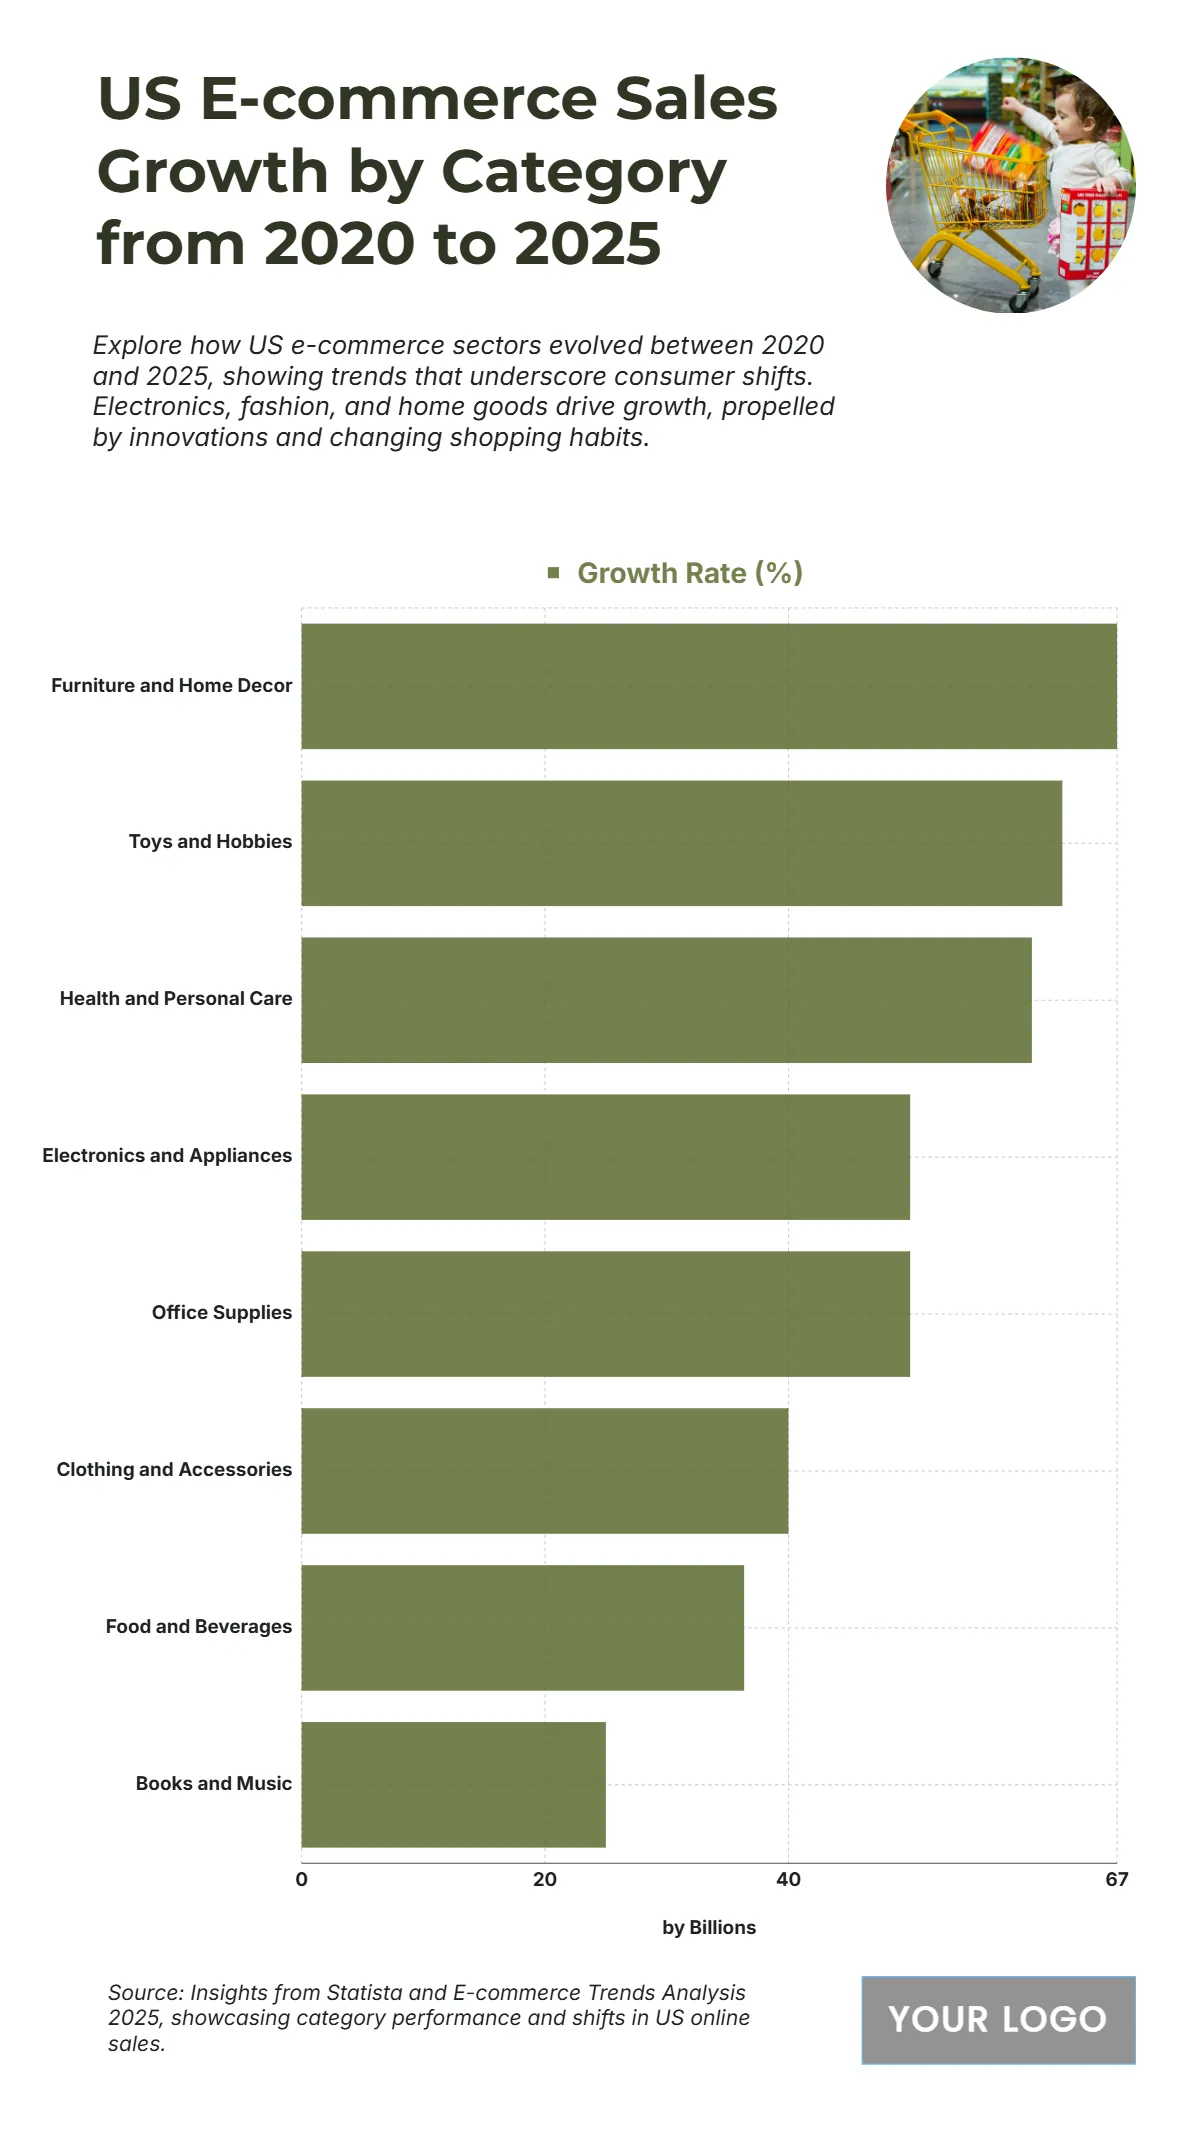
The chart highlights how various US e-commerce categories expanded between 2020 and 2025, revealing notable differences in growth performance. Furniture and Home Décor leads all sectors with a growth rate of 65%, driven by increased home improvement spending and interior-focused lifestyles. Following closely, Toys and Hobbies achieved a 60% growth rate, reflecting surging online purchases in recreational goods. Health and Personal Care recorded a 55% increase, boosted by heightened health awareness and digital health retailing. Electronics and Appliances and Office Supplies both posted 50% growth, underscoring steady demand for home office setups and tech products. Meanwhile, Clothing and Accessories reached 45%, supported by fashion e-commerce innovations. Food and Beverages showed a 40% rise, highlighting growing trust in online grocery platforms. Lastly, Books and Music grew 25%, showing moderate but stable demand. Overall, the data demonstrates that lifestyle, convenience, and digital adoption remain key drivers of US e-commerce expansion.
| Labels | Growth Rate (%) |
|---|---|
| Furniture and Home Decor | 67 |
| Toys and Hobbies | 62.5 |
| Health and Personal Care | 60 |
| Electronics and Appliances | 50 |
| Office Supplies | 50 |
| Clothing and Accessories | 40 |
| Food and Beverages | 38.36 |
| Books and Music | 25 |


