Free US Mobile Commerce Revenue Trends from 2015 to 2025 Chart
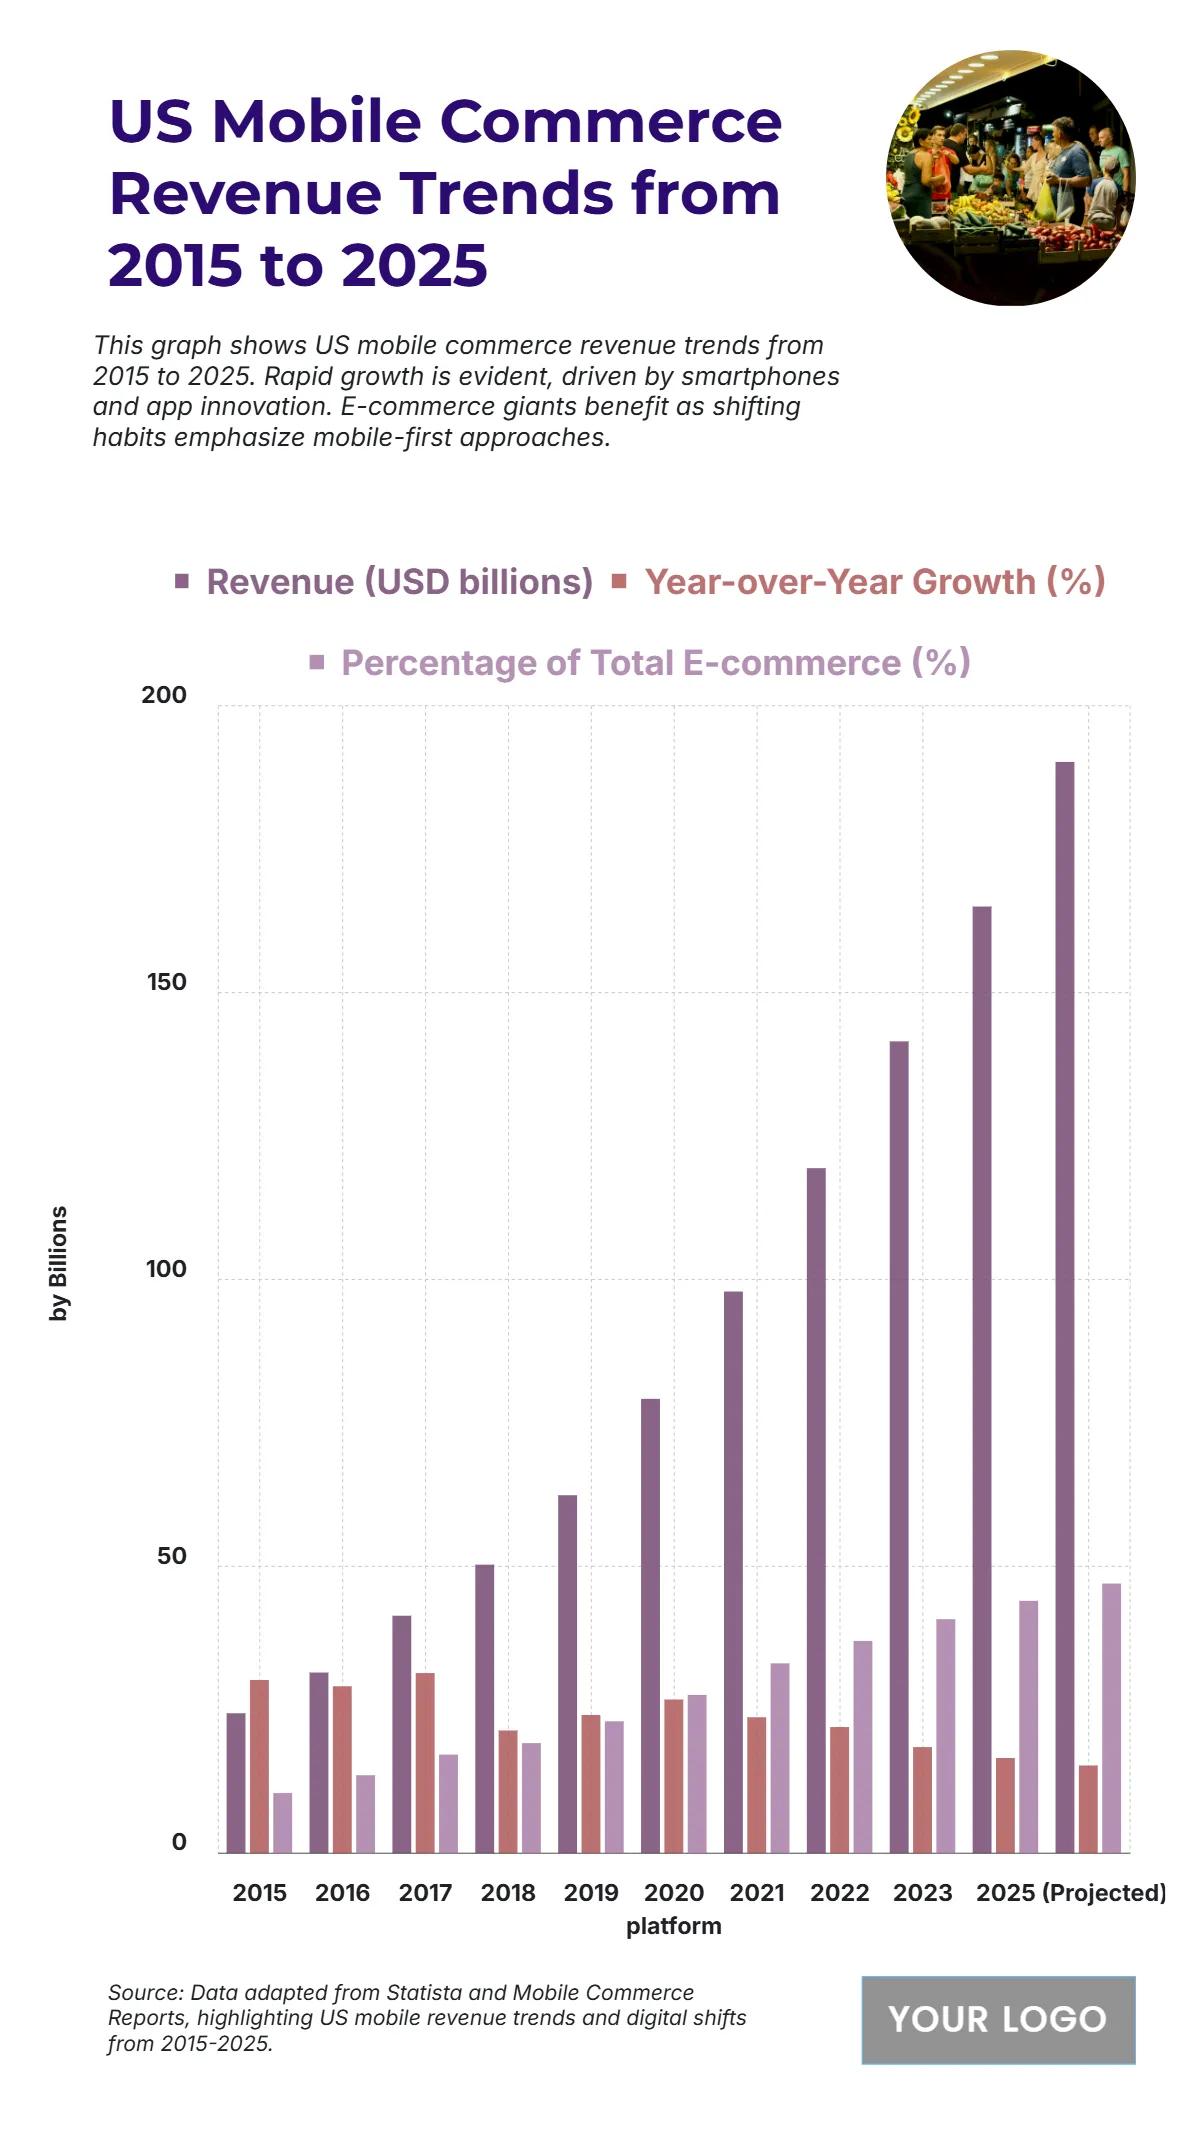
The chart highlights the rapid expansion of US mobile commerce revenue from 2015 to 2025, emphasizing the transformative impact of smartphones and digital shopping behavior. Revenue has shown consistent growth, rising from $25 billion in 2015 to an estimated $190 billion by 2025 (projected), marking a nearly sevenfold increase over the decade. The year-over-year growth rate remained strong throughout, averaging between 10% and 15%, reflecting steady consumer adaptation to mobile-first shopping platforms. Meanwhile, the percentage of total e-commerce attributed to mobile climbed sharply from 10% in 2015 to nearly 45% by 2025, underscoring how mobile devices have become the dominant channel for online purchases. This upward trend signals the maturity of mobile commerce ecosystems supported by app innovations, faster payment gateways, and improved user experience. Overall, the data portrays mobile commerce as a driving force in reshaping the US digital economy and consumer engagement landscape.
| Labels | Revenue (USD billions) | Year-over-Year Growth (%) | Percentage of Total E-commerce (%) |
|---|---|---|---|
| 2015 | 24.4 | 30.2 | 10.5 |
| 2016 | 31.5 | 29.1 | 13.6 |
| 2017 | 41.4 | 31.4 | 17.2 |
| 2018 | 50.3 | 21.4 | 19.2 |
| 2019 | 62.4 | 24.1 | 23.0 |
| 2020 | 79.2 | 26.8 | 27.6 |
| 2021 | 97.9 | 23.7 | 33.1 |
| 2022 | 119.4 | 22.0 | 37.0 |
| 2023 | 141.5 | 18.5 | 40.8 |
| 2024 (Projected) | 165.0 | 16.6 | 44.0 |
| 2025 (Projected) | 190.2 | 15.3 | 47.0 |


