Free US Content Marketing ROI by Industry from 2018 to 2025 Chart
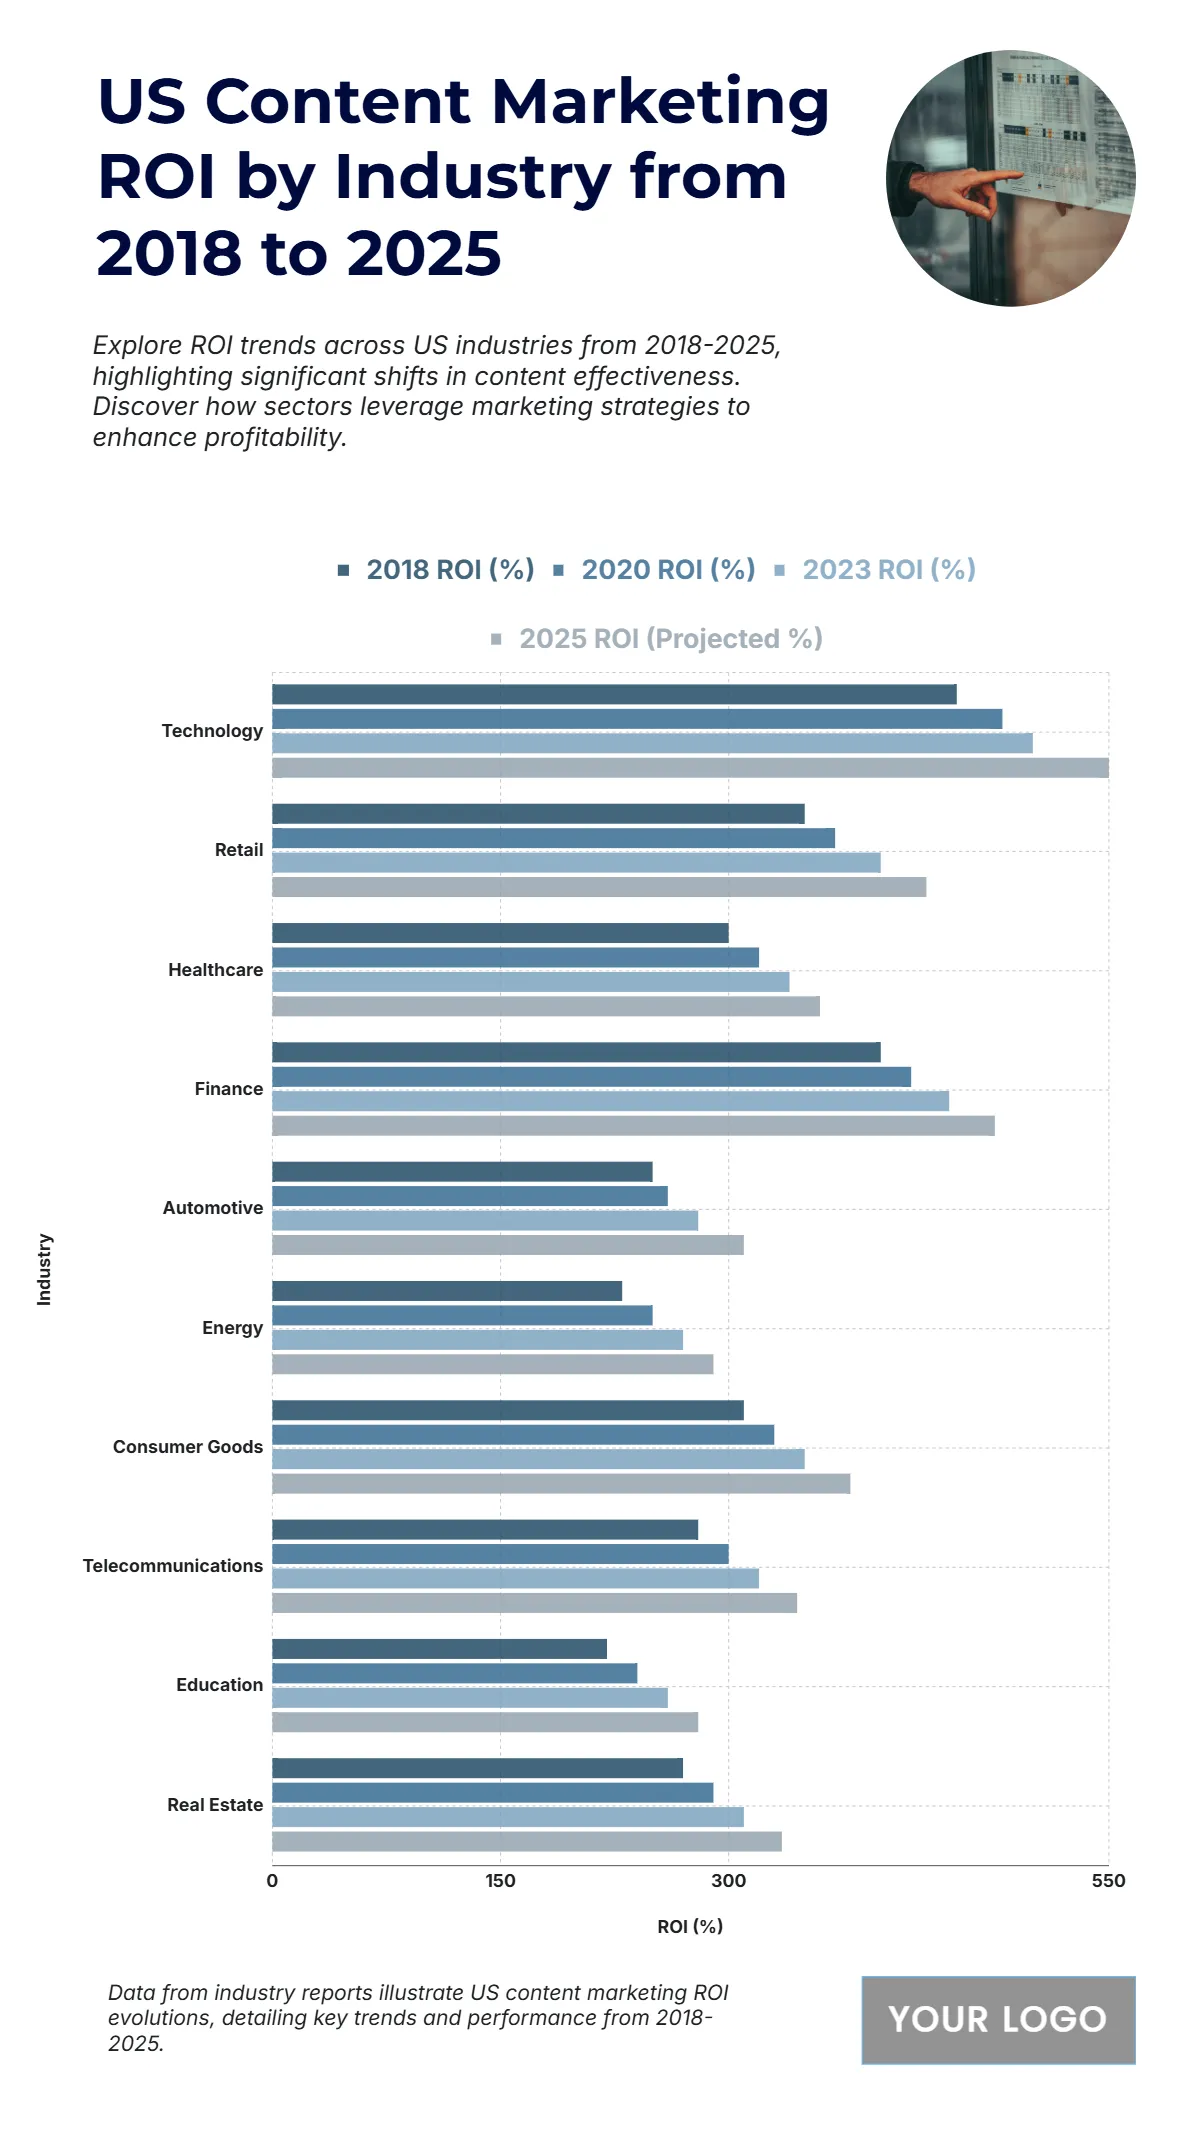
The chart illustrates the evolving Return on Investment (ROI) across major US industries from 2018 to 2025, showing consistent growth driven by digital transformation and data-driven strategies. Technology leads with the highest projected ROI of 420% by 2025, reflecting continued dominance in content innovation and automation. Finance follows closely with 400%, as fintech and digital banking expand their marketing efficiency. Retail maintains a strong performance, reaching 370%, supported by e-commerce and omnichannel engagement. Healthcare rises to 340%, driven by telehealth expansion and digital awareness campaigns. Telecommunications and Consumer Goods each reach around 320%, benefiting from increased digital connectivity and online branding. Automation and Energy sectors record moderate gains of 300% and 290%, while Real Estate climbs to 310%, supported by virtual marketing tools. Education, though lower at 280%, still shows steady improvement as online learning platforms grow. Overall, the data underscores a robust upward trend across industries.
| Labels | 2018 ROI (%) | 2020 ROI (%) | 2023 ROI (%) | 2025 ROI (Projected %) |
|---|---|---|---|---|
| Technology | 450 | 480 | 500 | 550 |
| Retail | 350 | 370 | 400 | 430 |
| Healthcare | 300 | 320 | 340 | 360 |
| Finance | 400 | 420 | 445 | 475 |
| Automotive | 250 | 260 | 280 | 310 |
| Energy | 230 | 250 | 270 | 290 |
| Consumer Goods | 310 | 330 | 350 | 380 |
| Telecommunications | 280 | 300 | 320 | 345 |
| Education | 220 | 240 | 260 | 280 |
| Real Estate | 270 | 290 | 310 | 335 |


