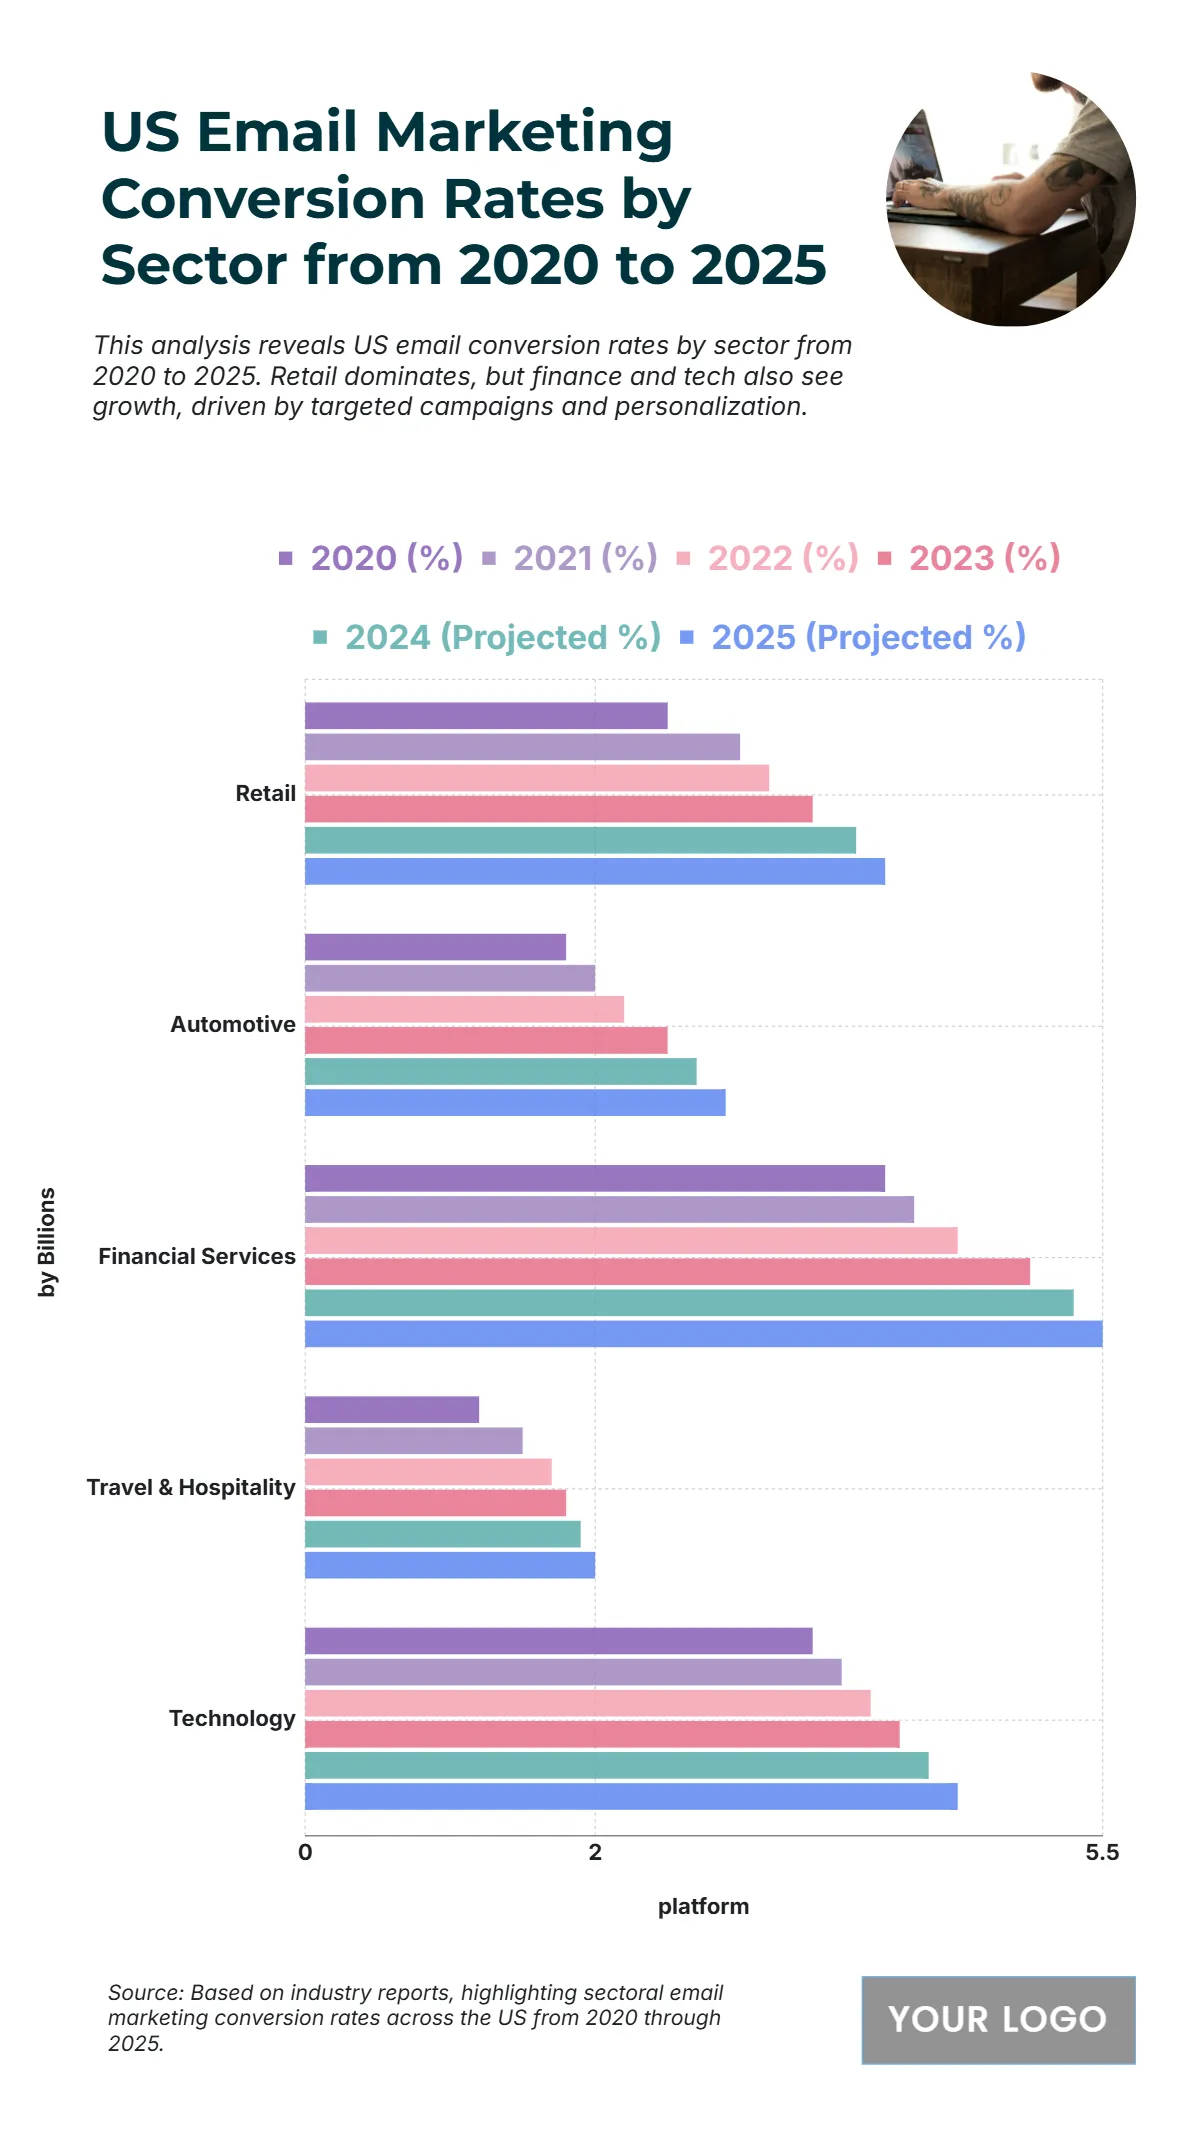
Free US Email Marketing Conversion Rates by Sector from 2020 to 2025 Chart
The chart illustrates how US email marketing conversion rates have evolved across various sectors from 2020 to 2025, showing a consistent upward trend in performance. Financial Services leads with the highest projected conversion rate of 5.4% by 2025, rising from 4.7% in 2020, driven by personalized and data-driven campaigns. Retail follows closely, improving from 4.2% in 2020 to 5.0% in 2025, supported by advanced targeting and e-commerce integration. The Technology sector also shows steady growth, reaching 4.8% in 2025 from 4.0% in 2020, reflecting enhanced automation and segmentation. Meanwhile, Automotive improves modestly from 3.0% to 3.8%, and Travel & Hospitality rebounds post-pandemic, climbing from 2.1% in 2020 to 2.7% in 2025. Overall, the data highlights a strong digital transformation across industries, emphasizing how strategic personalization and improved analytics have led to higher engagement and conversion success through email marketing channels.
| Labels | 2020 (%) | 2021 (%) | 2022 (%) | 2023 (%) | 2024 (Projected %) | 2025 (Projected %) |
|---|---|---|---|---|---|---|
| Retail | 2.5 | 3.0 | 3.2 | 3.5 | 3.8 | 4.0 |
| Automotive | 1.8 | 2.0 | 2.2 | 2.5 | 2.7 | 2.9 |
| Financial Services | 4.0 | 4.2 | 4.5 | 5.0 | 5.3 | 5.5 |
| Travel & Hospitality | 1.2 | 1.5 | 1.7 | 1.8 | 1.9 | 2.0 |
| Technology | 3.5 | 3.7 | 3.9 | 4.1 | 4.3 | 4.5 |


