Free US Advertising Expenditure by Media Type from 2018 to 2025 Chart
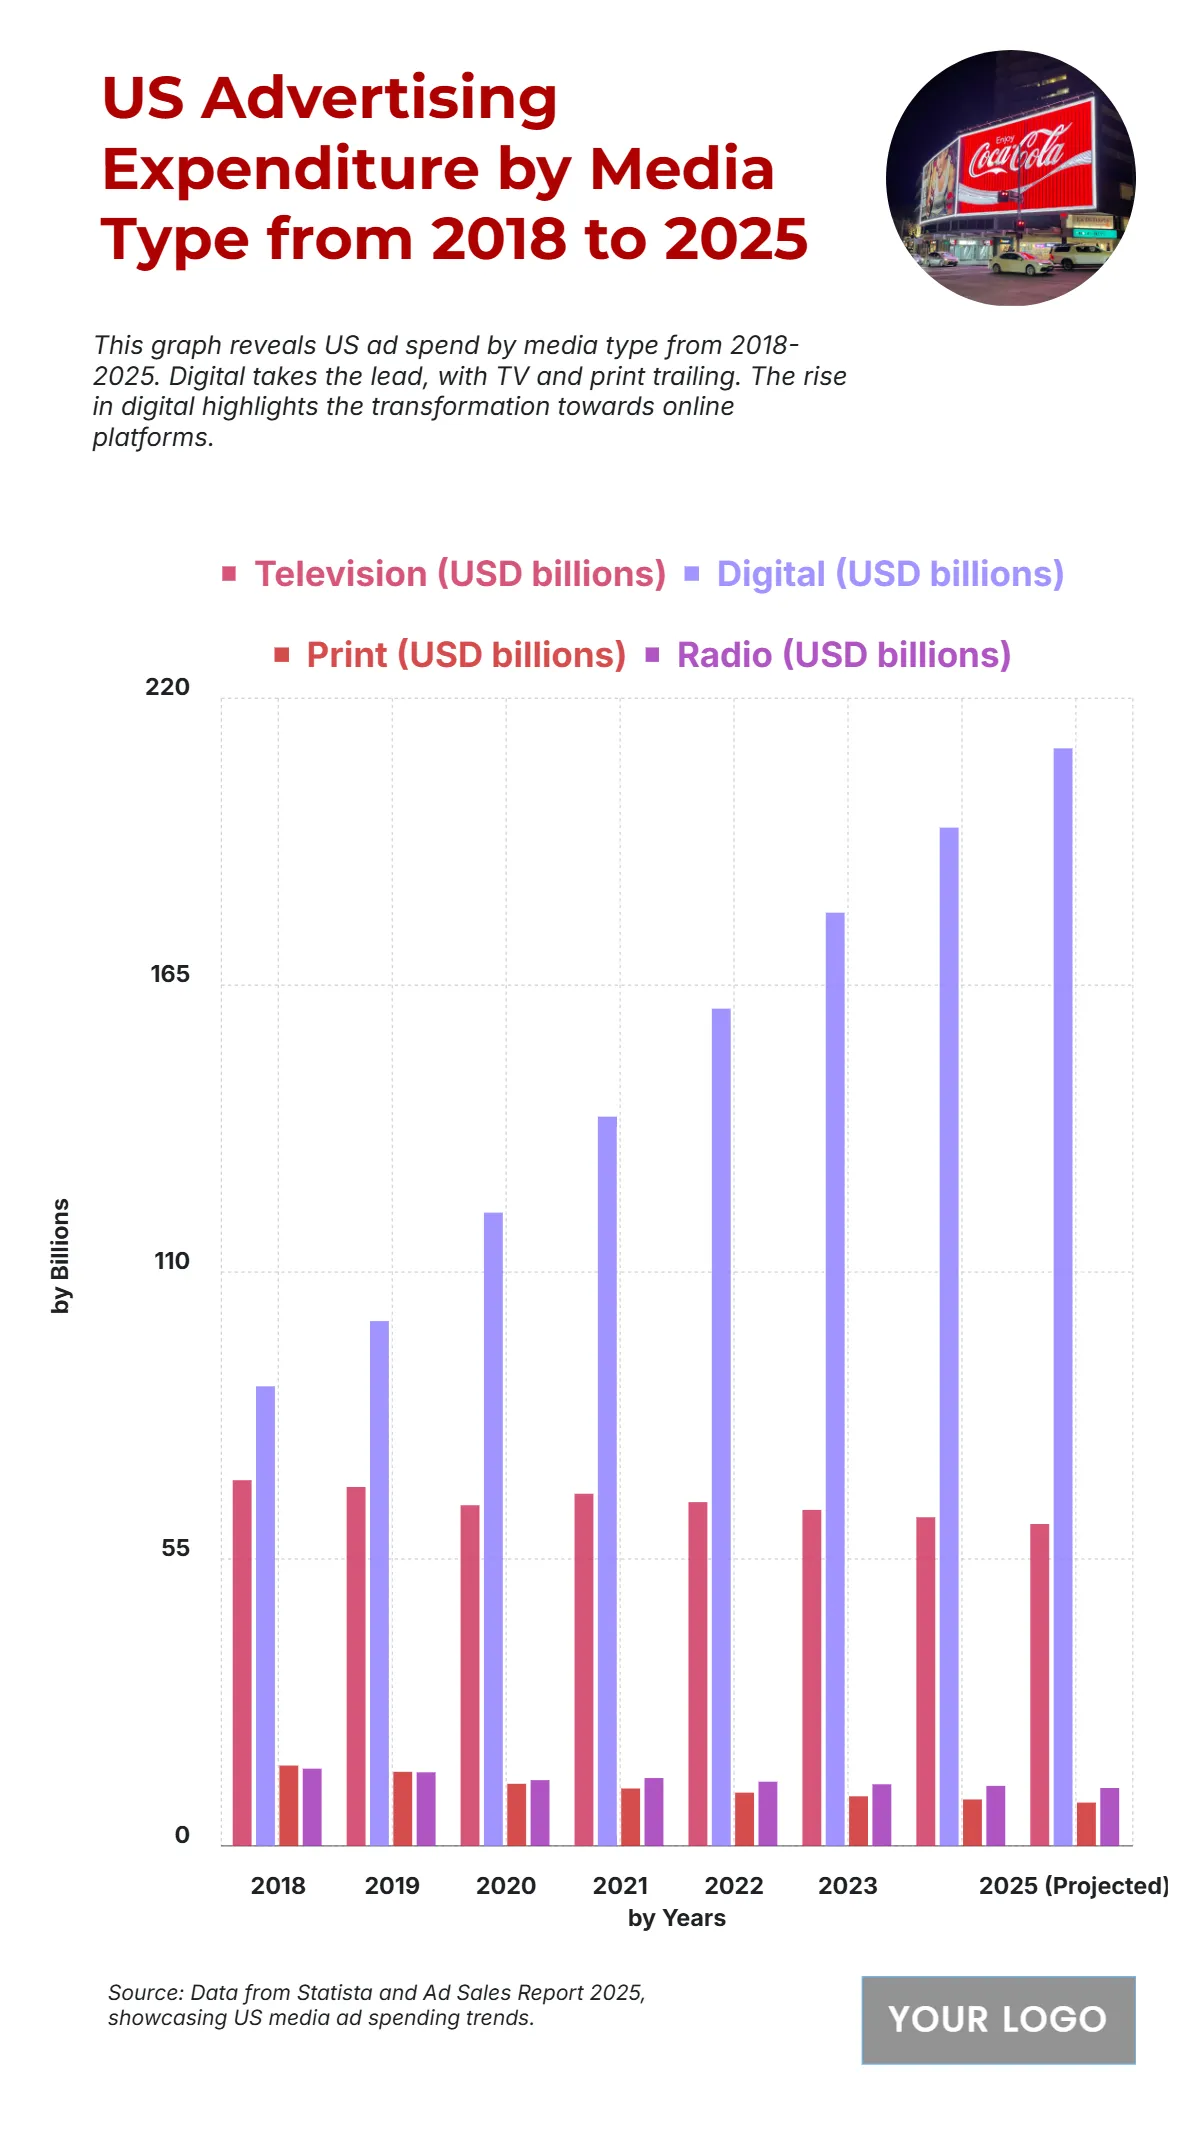
The chart highlights the evolving US advertising expenditure trends by media type from 2018 to 2025, revealing the dominance of digital advertising over traditional platforms. Digital ad spending shows a sharp and consistent rise, reaching USD 220 billion by 2025 (projected), more than doubling its 2018 level of USD 80 billion, signifying a major shift toward online and mobile platforms. In contrast, television spending remains relatively stable, averaging around USD 70 billion throughout the period, indicating stagnant growth. Print advertising experiences a steady decline, dropping from USD 15 billion in 2018 to around USD 8 billion by 2025, reflecting reduced reliance on newspapers and magazines. Radio ads also show a gradual decline, falling from USD 10 billion to roughly USD 7 billion. This data underscores a profound transition from traditional to digital media, driven by the increasing effectiveness, reach, and analytics capabilities of online advertising in the modern marketing landscape.
| Labels | Television (USD billions) | Digital (USD billions) | Print (USD billions) | Radio (USD billions) |
|---|---|---|---|---|
| 2018 | 70.1 | 88.1 | 15.4 | 14.8 |
| 2019 | 68.8 | 100.6 | 14.2 | 14.1 |
| 2020 | 65.3 | 121.4 | 11.9 | 12.6 |
| 2021 | 67.5 | 139.8 | 11.0 | 13.0 |
| 2022 | 65.9 | 160.5 | 10.2 | 12.3 |
| 2023 | 64.4 | 178.9 | 9.5 | 11.8 |
| 2024 | 63.0 | 195.2 | 8.9 | 11.5 |
| 2025 (Projected) | 61.7 | 210.4 | 8.3 | 11.1 |


