Free US Online Video Consumption by Age Group from 2015 to 2025 Chart
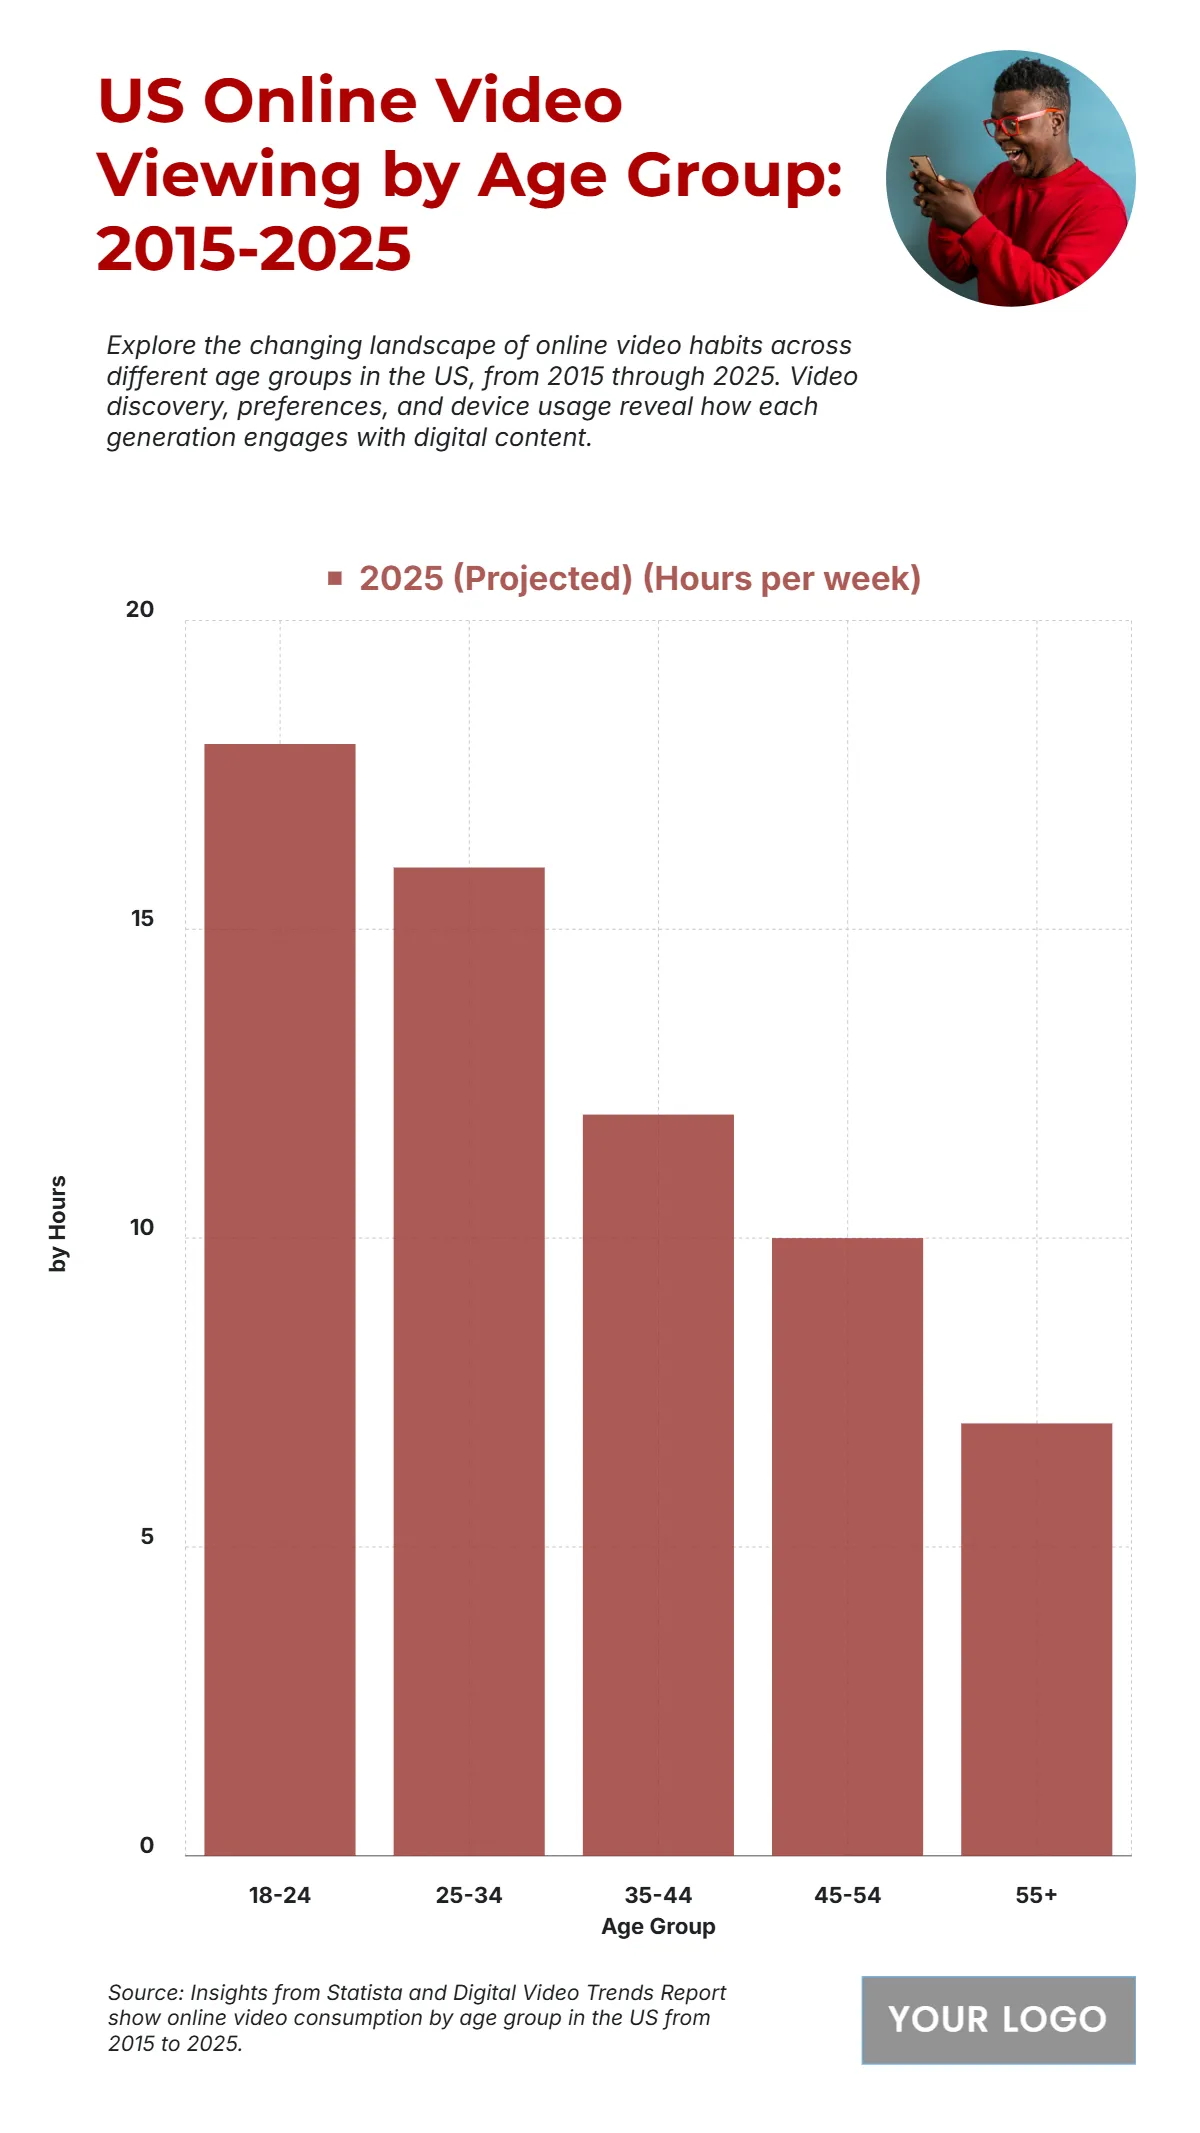
The chart illustrates the projected online video viewing habits in the U.S. by age group for 2025, revealing how digital consumption varies across generations. The 18–24 age group leads with the highest engagement, averaging 18 hours per week, followed by the 25–34 group at 16 hours weekly, reflecting the dominance of younger audiences in digital video consumption. The 35–44 demographic spends around 12 hours per week, while the 45–54 group records a moderate 10 hours, indicating a gradual decline with age. Meanwhile, the 55+ age group spends the least time, averaging 7 hours weekly, showing lower adoption of streaming and online platforms. Overall, the data highlights a clear generational divide in digital media habits, with younger audiences spending over twice as much time watching online videos compared to older ones, emphasizing the continued importance of youth-driven engagement strategies for advertisers and content creators in the digital landscape.
| Labels | 2025 (Projected) (Hours per week) |
|---|---|
| 18–24 | 18 |
| 25–34 | 16 |
| 35–44 | 12 |
| 45–54 | 10 |
| 55+ | 7 |


