Free US Retail Holiday Advertising Spending by Sector from 2015 to 2025 Chart
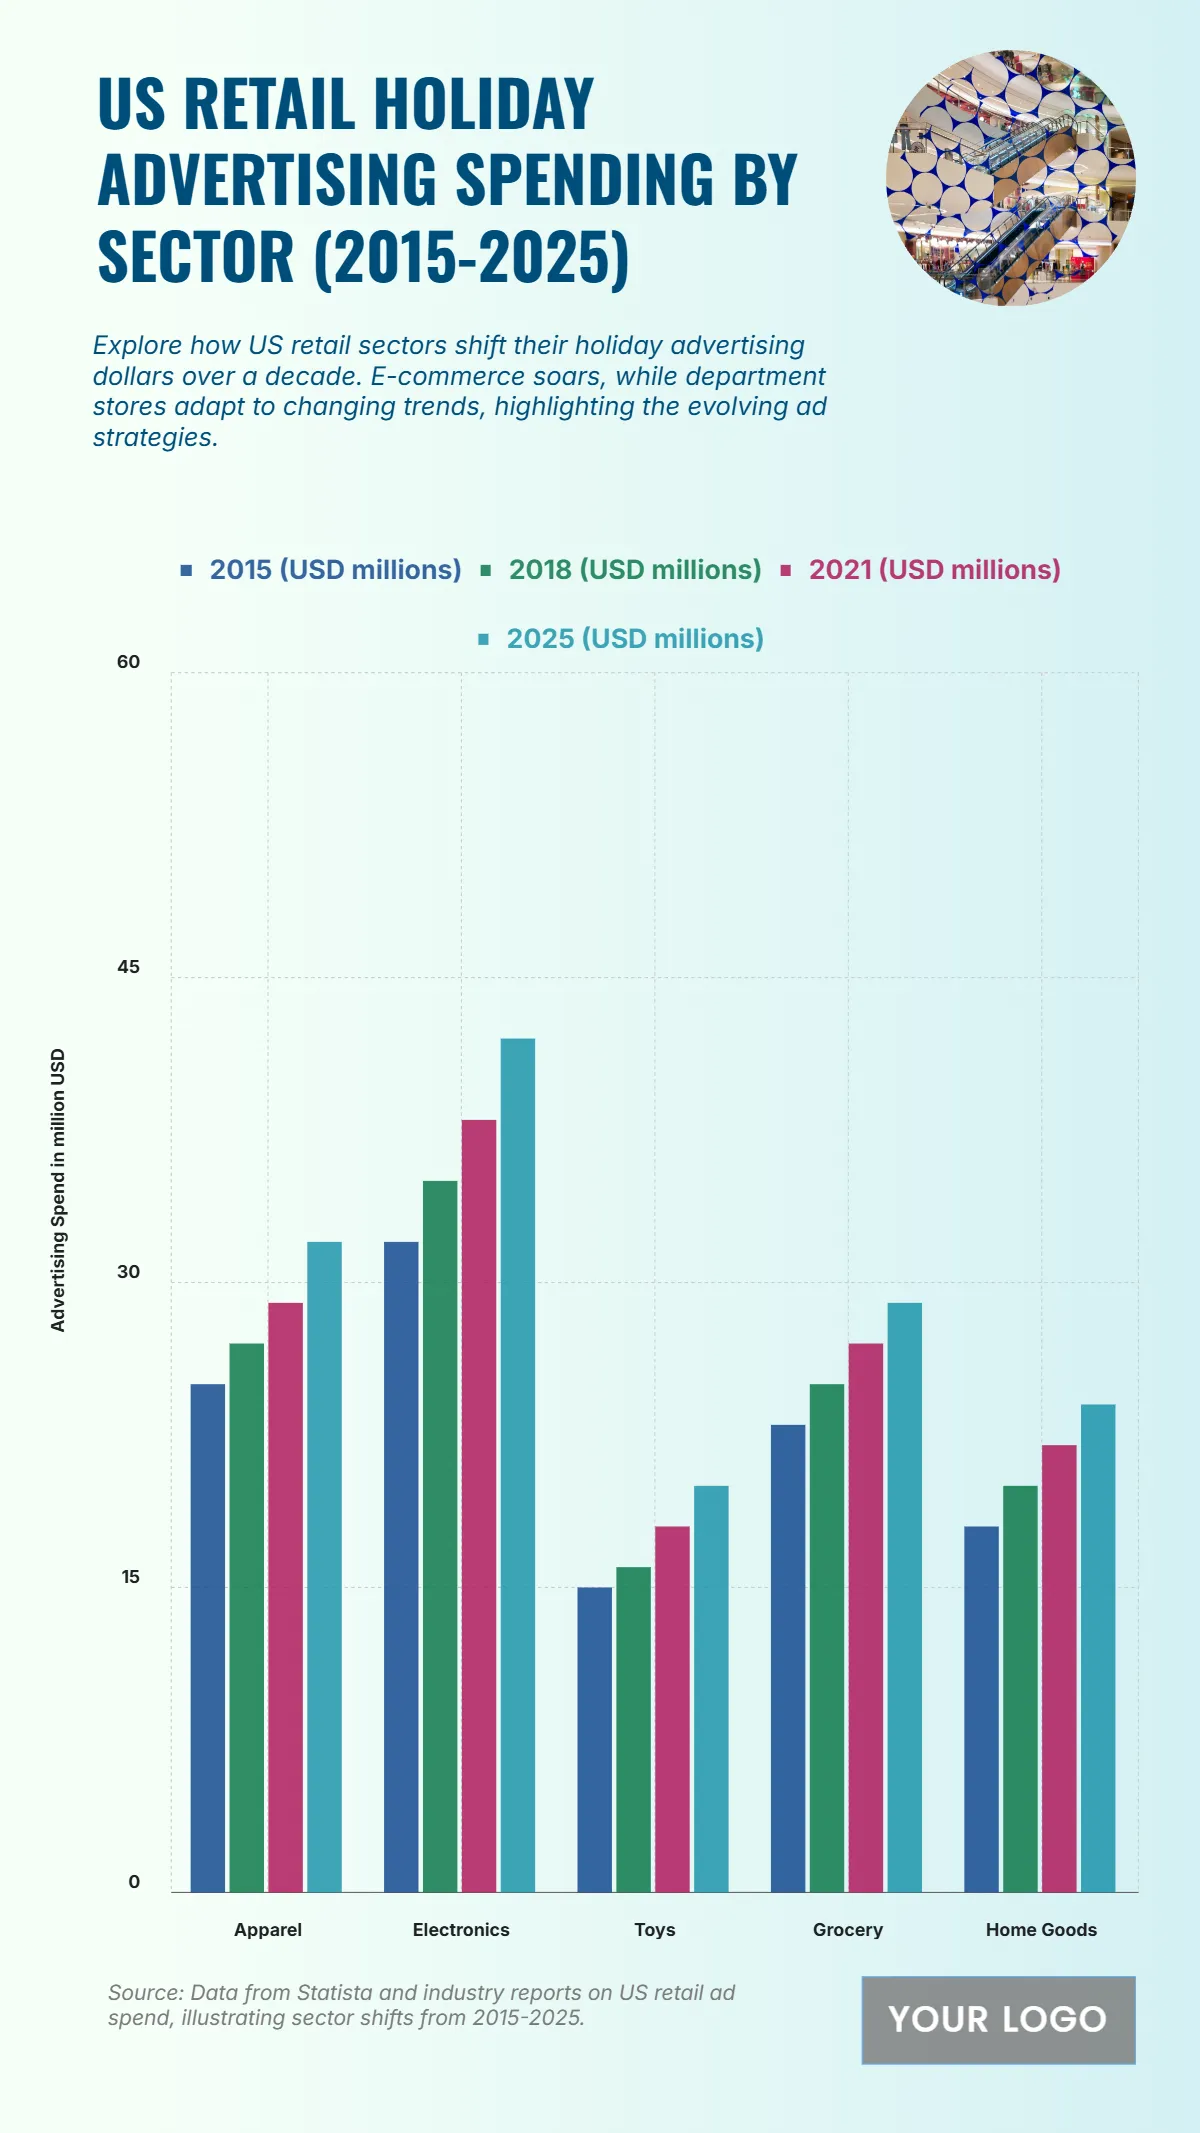
The chart illustrates changes in U.S. retail holiday advertising spending by sector from 2015 to 2025, showing consistent growth across all categories as digital marketing becomes more prominent. Electronics lead throughout the decade, increasing from $32 million in 2015 to a projected $42 million in 2025, driven by strong consumer demand for gadgets during holiday seasons. Apparel follows closely, climbing from $25 million to $32 million, reflecting the ongoing rise of e-commerce and online fashion promotions. Grocery advertising also shows notable growth from $23 million to $29 million, indicating retailers’ focus on festive food marketing. Home Goods steadily increase from $18 million in 2015 to $24 million by 2025, supported by holiday home-decor campaigns. Meanwhile, Toys record a modest rise from $15 million to $20 million, maintaining seasonal popularity. Overall, the chart emphasizes steady expansion in retail ad budgets, especially within technology and lifestyle categories.
| Labels | 2015 (USD millions) | 2018 (USD millions) | 2021 (USD millions) | 2025 (USD millions) |
|---|---|---|---|---|
| Apparel | 25 | 27 | 29 | 32 |
| Electronics | 32 | 35 | 38 | 42 |
| Toys | 15 | 16 | 18 | 20 |
| Grocery | 23 | 25 | 27 | 29 |
| Home Goods | 18 | 20 | 22 | 24 |


