Free US OTT Platform Advertising Revenue Growth from 2015 to 2025 Chart
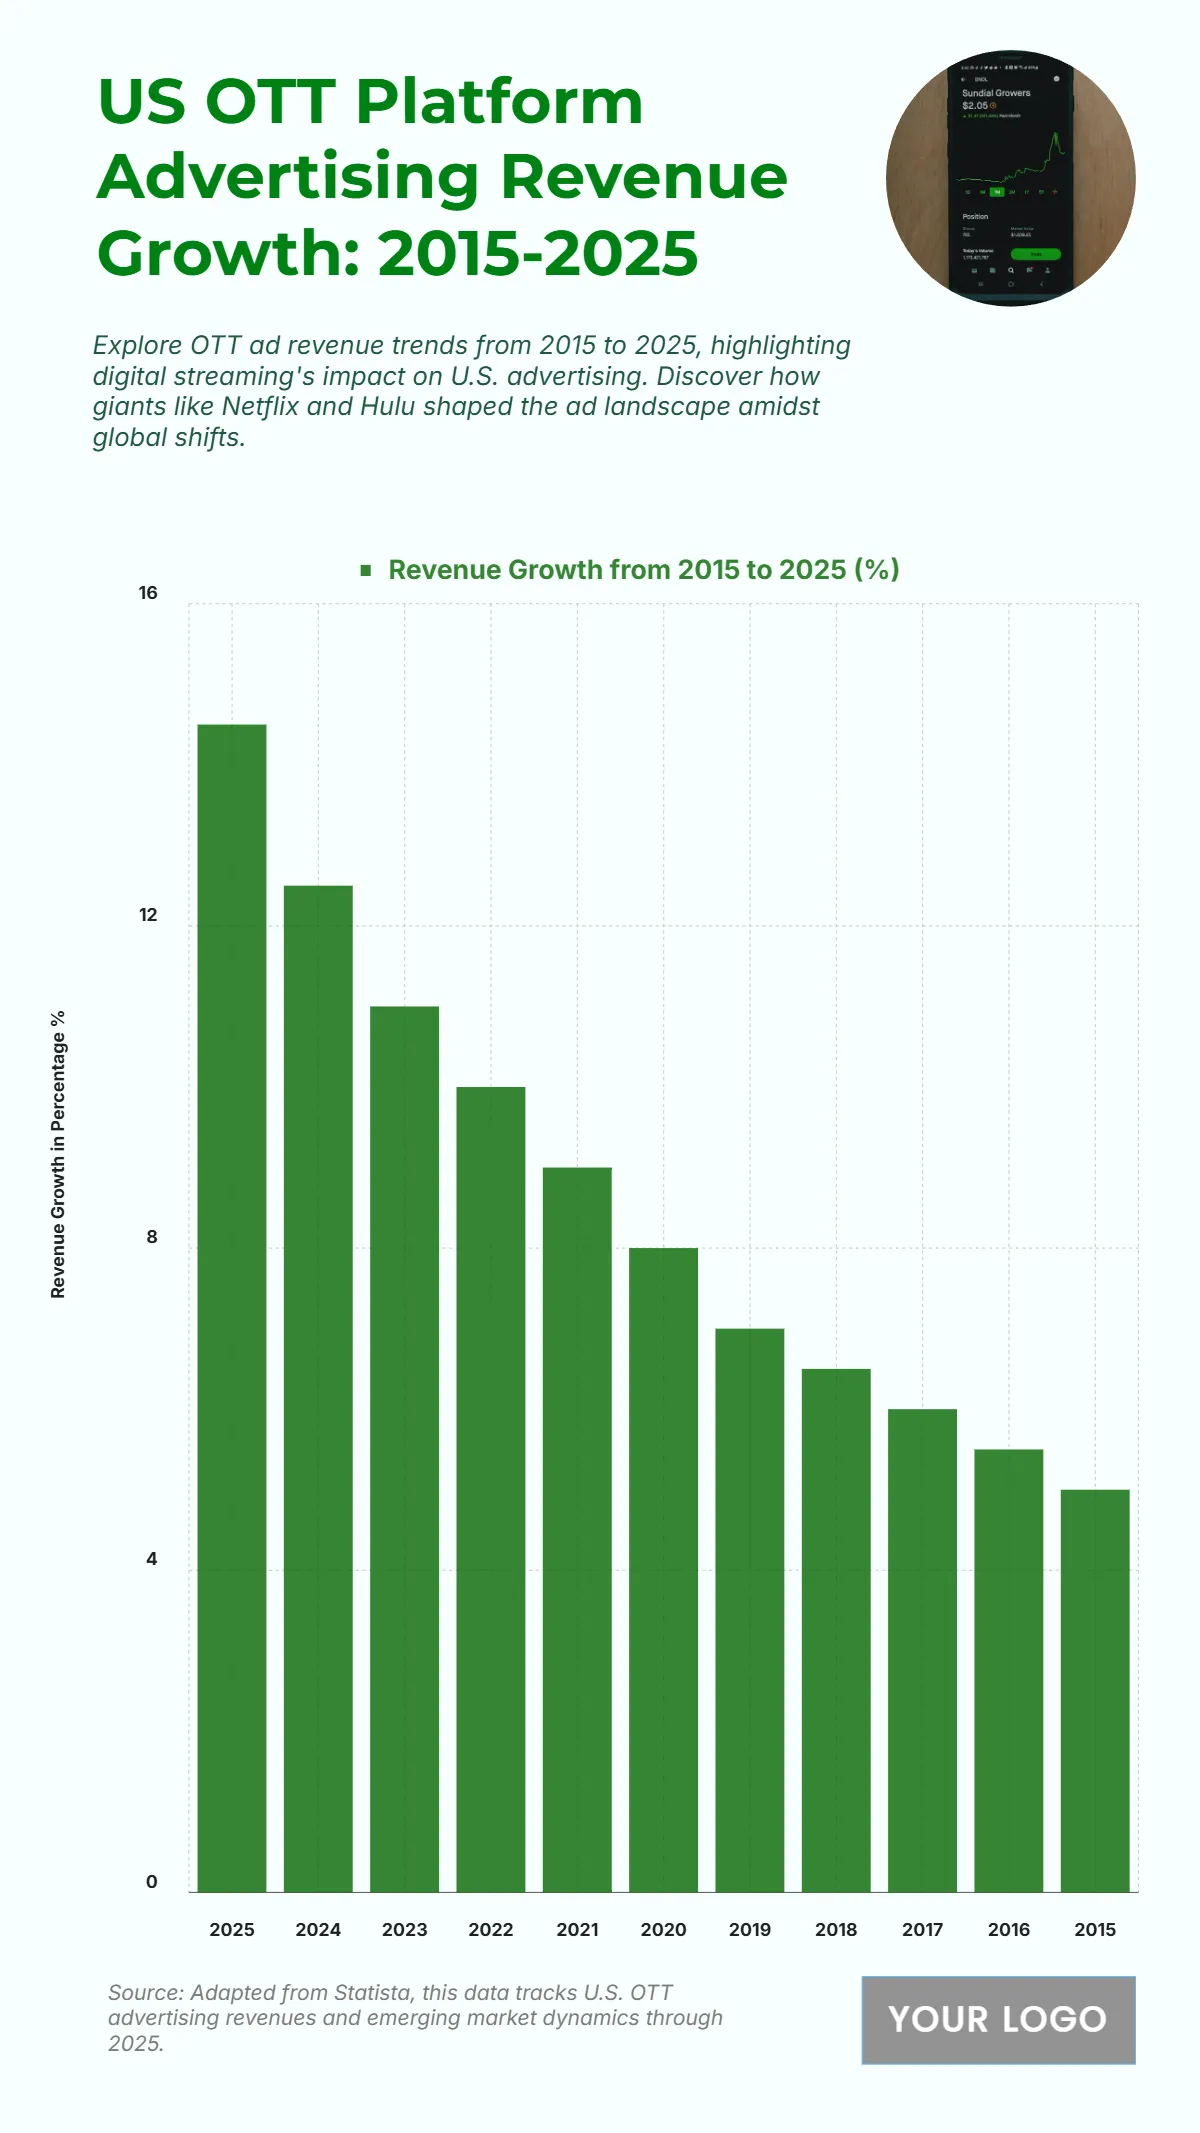
The chart showcases the U.S. OTT (Over-The-Top) platform advertising revenue growth from 2015 to 2025, emphasizing the significant expansion of digital streaming ad markets. The data reveals a steady and continuous rise in ad revenue growth over the decade, starting from 5% in 2015 and climbing to 14.5% by 2025. Growth gradually accelerated through the years, reaching 6% in 2017, 8% in 2020, and 10% in 2022, highlighting the increased adoption of streaming services such as Netflix, Hulu, and Disney+. The most substantial leap occurs between 2023 and 2025, with growth increasing from 11% to 14.5%, driven by the surge in digital content consumption and targeted advertising technologies. This consistent upward trend reflects advertisers’ shifting focus from traditional media to online platforms, capitalizing on OTT’s vast audiences and data-driven marketing efficiency, ultimately making it a dominant force in the evolving U.S. advertising landscape.
| Labels | Revenue Growth from 2015 to 2025 (%) |
|---|---|
| 2025 | 14.5 |
| 2024 | 12.5 |
| 2023 | 11 |
| 2022 | 10 |
| 2021 | 9 |
| 2020 | 8 |
| 2019 | 7 |
| 2018 | 6.5 |
| 2017 | 6 |
| 2016 | 5.5 |
| 2015 | 5 |


