Free US Ad Spending Growth in Mobile Apps from 2015 to 2025 Chart
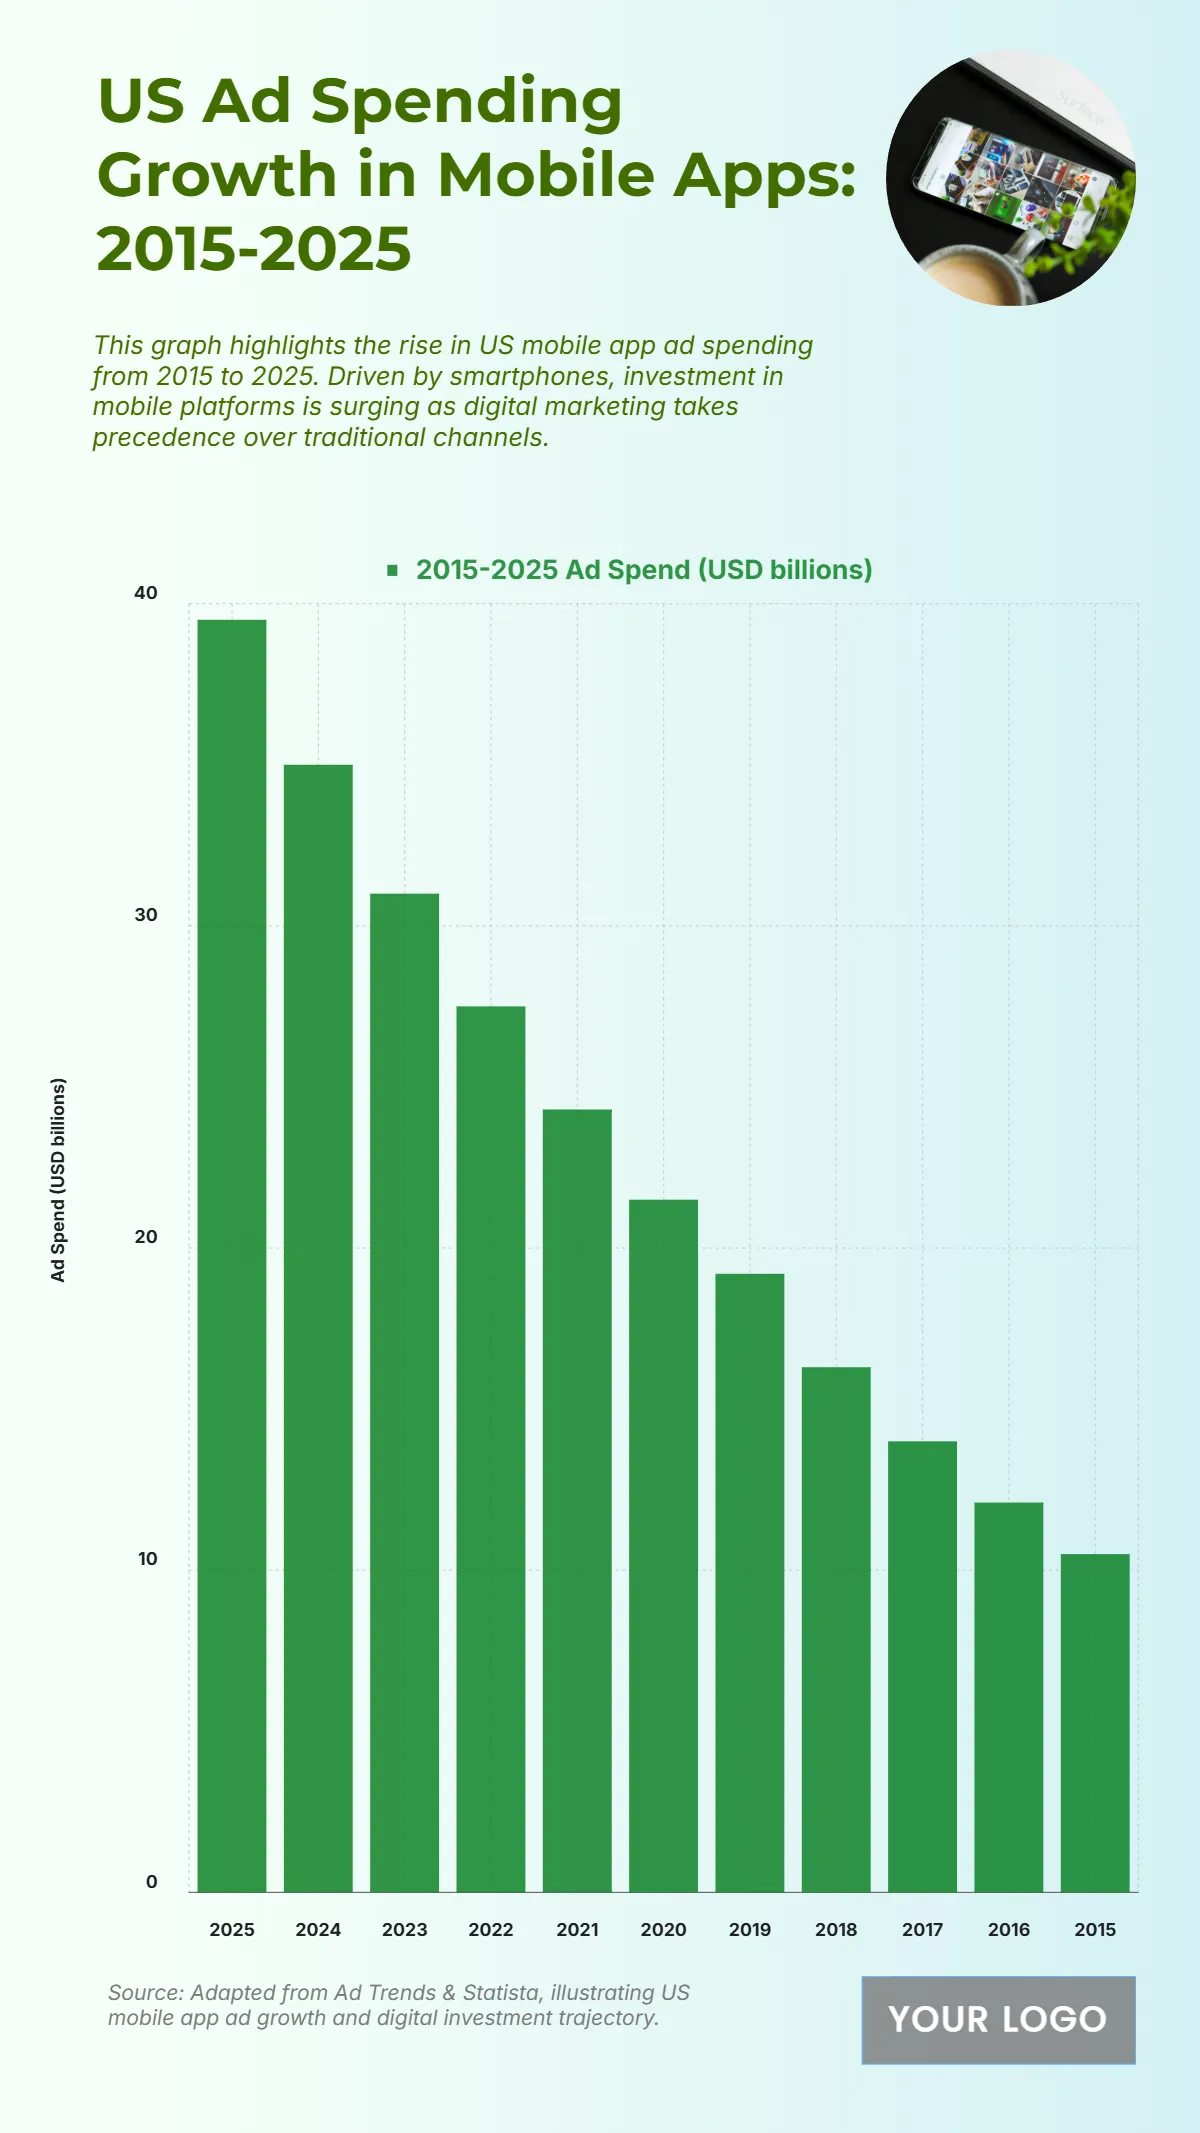
The chart illustrates the rapid increase in U.S. ad spending within mobile apps from 2015 to 2025, emphasizing the shift toward mobile-first marketing strategies. The data shows a consistent upward trajectory, starting from $10.5 billion in 2015 and reaching a projected $39.5 billion by 2025, marking nearly a fourfold increase over the decade. Spending crossed $20 billion by 2020 and continued to surge as mobile engagement expanded. Significant growth was observed in 2021 ($24.3B), 2022 ($27.5B), and 2023 ($31B), driven by app-based advertising innovations and user targeting capabilities. The steep rise in 2024 ($35B) and 2025 ($39.5B) highlights the increasing dominance of mobile platforms as advertisers prioritize app ecosystems over traditional web formats. This progression underscores how smartphones and digital applications have become central to modern advertising, with mobile channels projected to lead the U.S. ad landscape by 2025.
| Labels | 2015–2025 Ad Spend (USD billions) |
|---|---|
| 2025 | 39.5 |
| 2024 | 35 |
| 2023 | 31 |
| 2022 | 27.5 |
| 2021 | 24.3 |
| 2020 | 21.5 |
| 2019 | 19.2 |
| 2018 | 16.3 |
| 2017 | 14 |
| 2016 | 12.1 |
| 2015 | 10.5 |


