Free US Political Digital Advertising by Platform from 2020 to 2025 Chart
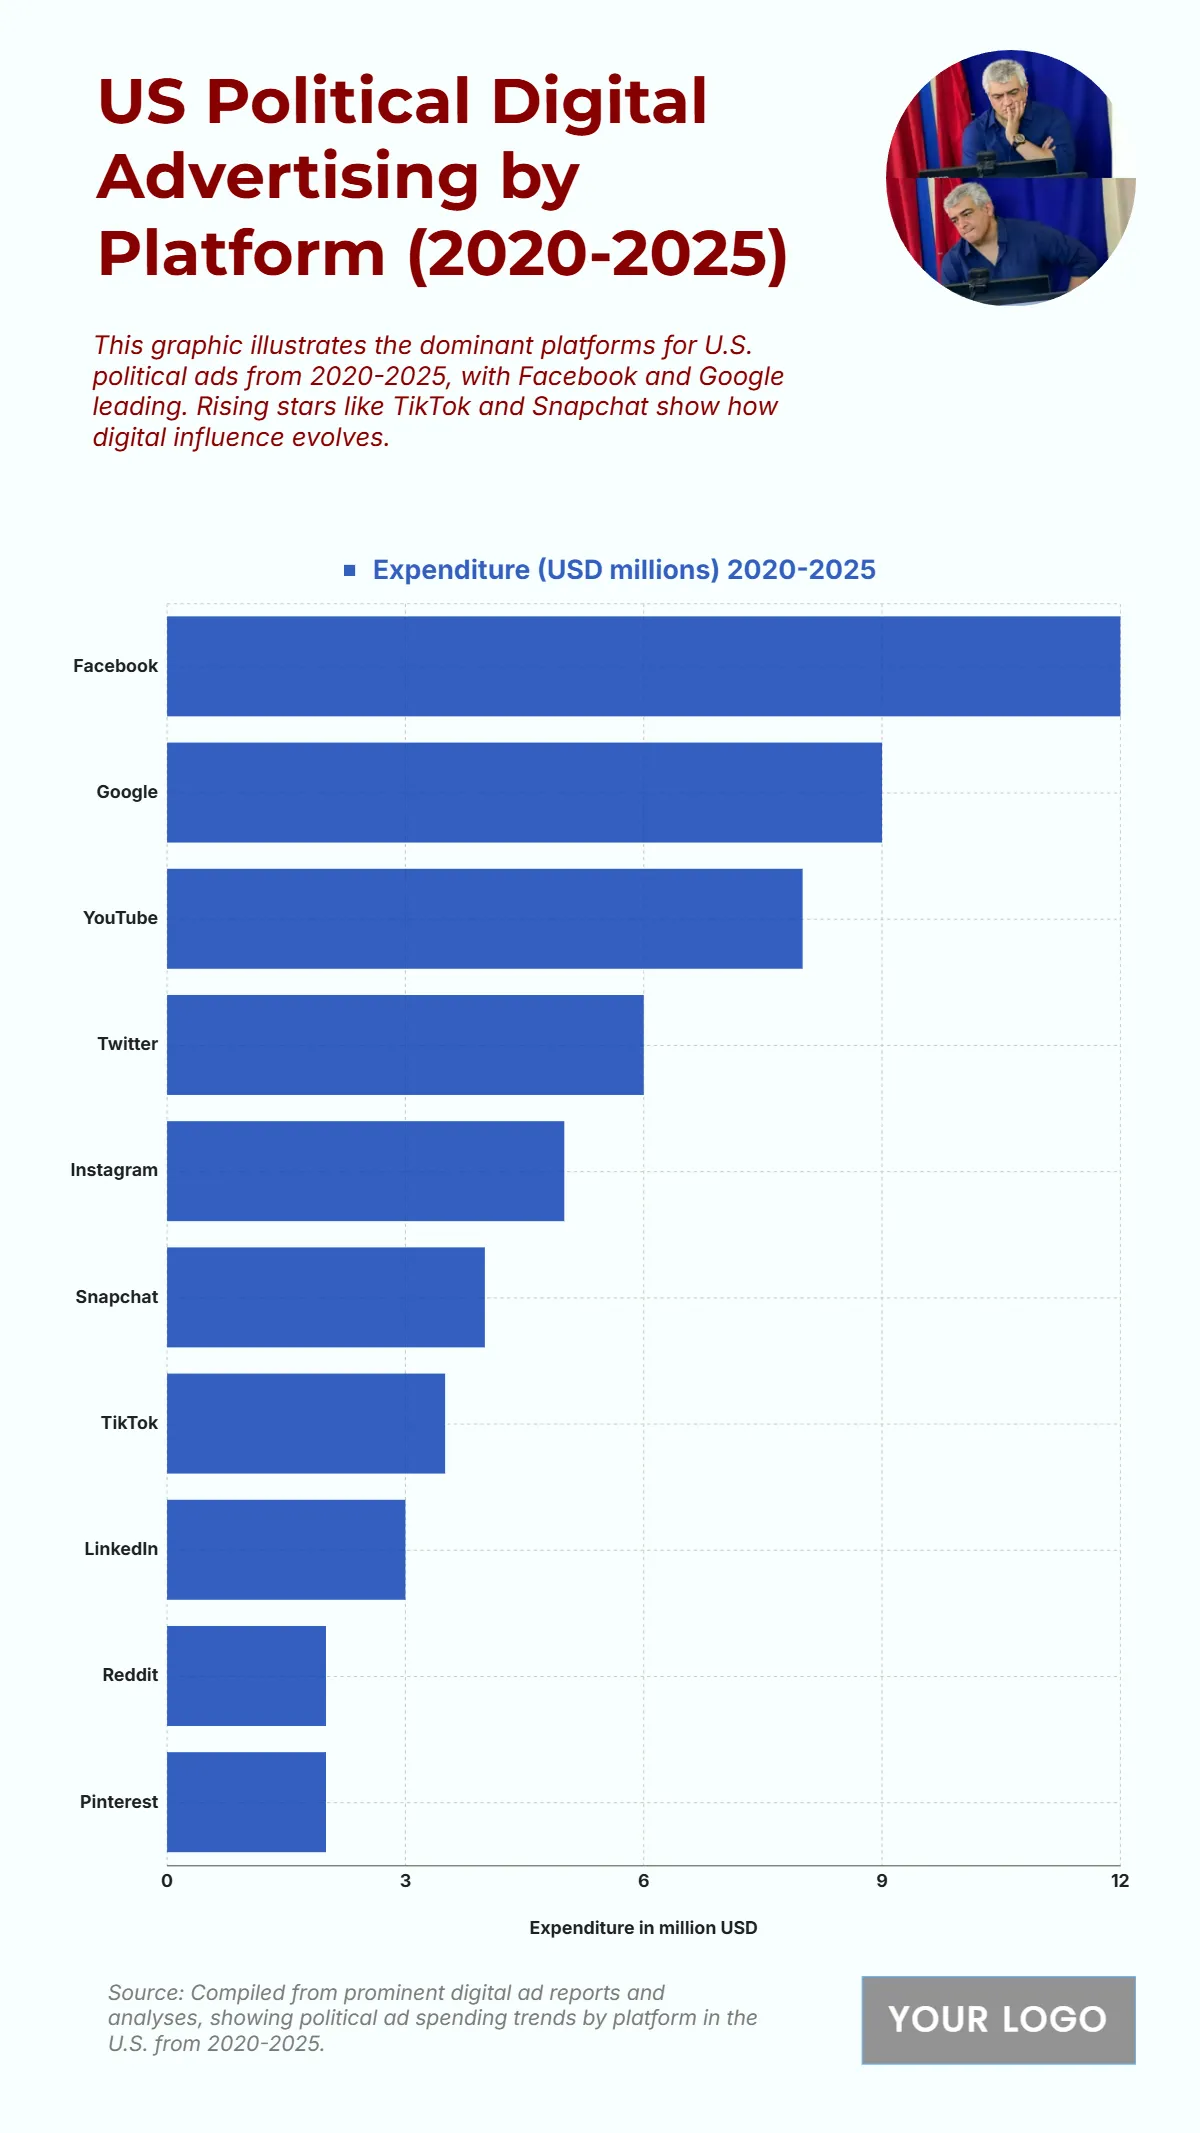
The chart illustrates the U.S. political digital advertising expenditure by platform between 2020 and 2025, showcasing where campaign budgets were concentrated in the digital sphere. Facebook leads as the top advertising platform with $12 million, demonstrating its continued dominance in political outreach and audience targeting. Google follows closely at $9 million, supported by its vast search and display networks. YouTube, a key video-based platform, accounts for $8 million, reflecting the growing use of video ads in political campaigns. Twitter and Instagram trail with $6 million and $5 million, respectively, emphasizing their influence in real-time engagement and visual storytelling. Emerging platforms such as Snapchat ($4M) and TikTok ($3.5M) show increasing importance among younger audiences, while LinkedIn ($3M) serves more professional demographics. Reddit and Pinterest, each with $2 million, hold smaller shares but highlight niche community engagement within political communication strategies.
| Labels | Expenditure (USD millions) 2020–2025 |
|---|---|
| 12 | |
| 9 | |
| YouTube | 8 |
| 6 | |
| 5 | |
| Snapchat | 4 |
| TikTok | 3.5 |
| 3 | |
| 2 | |
| 2 |


