Free US Native Advertising ROI by Industry from 2015 to 2025 Chart
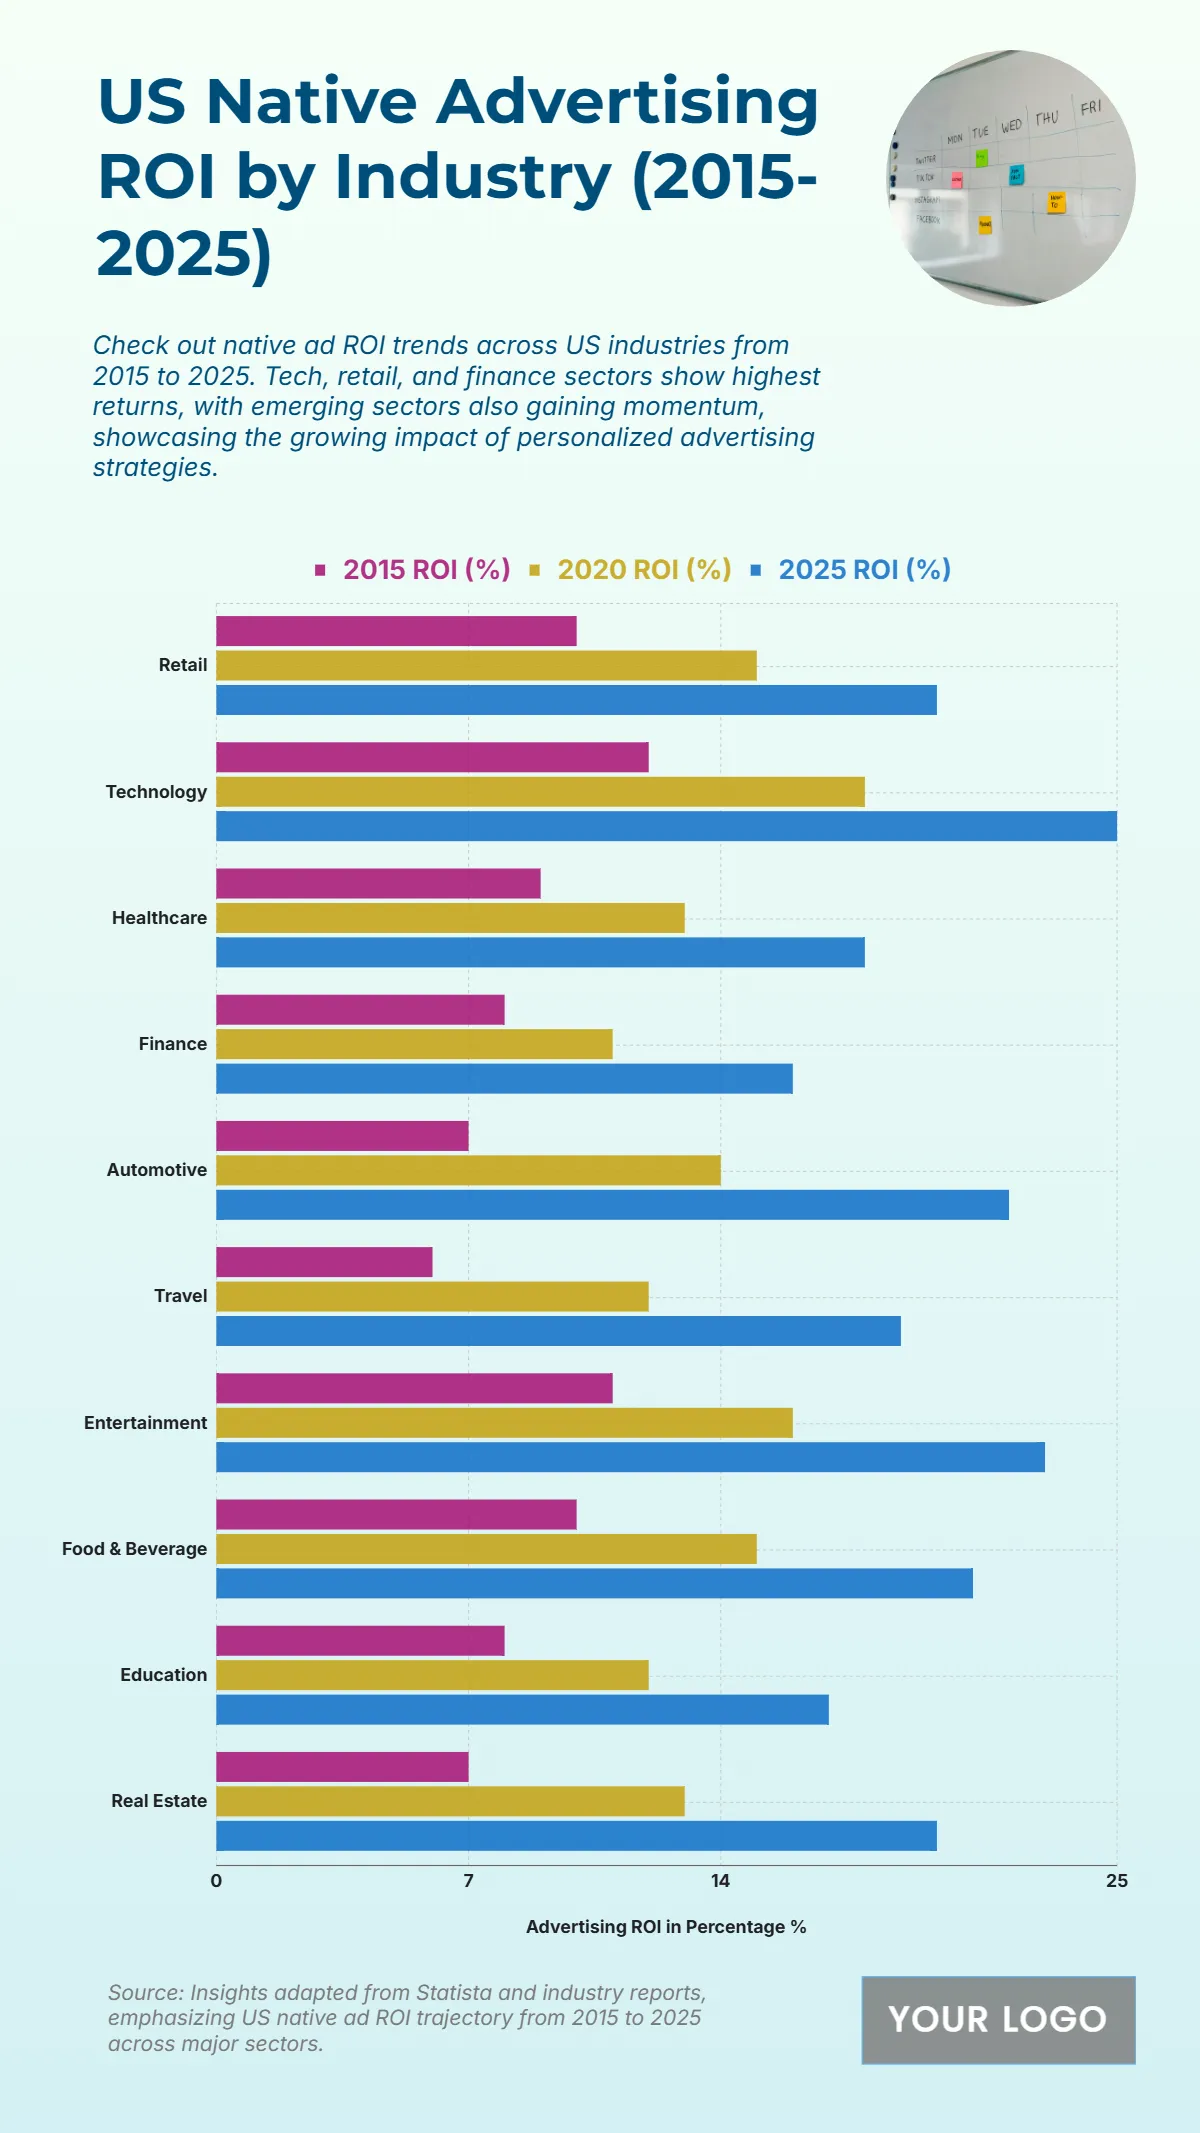
The chart highlights the steady growth of native advertising ROI across U.S. industries from 2015 to 2025, showing significant increases as personalized and contextual ads become more effective. Technology leads with an ROI rising from 12% in 2015 to 25% in 2025, followed by Entertainment (11% to 23%) and Automotive (7% to 22%), reflecting strong engagement in digital media and innovation-driven campaigns. Retail improves from 10% to 20%, indicating consistent consumer responsiveness, while Food & Beverage climbs from 10% to 21%, underscoring the impact of lifestyle-oriented marketing. Travel shows notable growth from 6% to 19%, and Healthcare increases from 9% to 18%, emphasizing expanding digital outreach. Finance and Real Estate both grow from 8% and 7% to 16% and 20%, respectively, while Education rises from 8% to 17%. Overall, the data demonstrates the increasing profitability of native advertising as industries embrace digital transformation.
| Labels | 2015 ROI (%) | 2020 ROI (%) | 2025 ROI (%) |
|---|---|---|---|
| Retail | 10 | 15 | 20 |
| Technology | 12 | 18 | 25 |
| Healthcare | 9 | 13 | 18 |
| Finance | 8 | 11 | 16 |
| Automotive | 7 | 14 | 22 |
| Travel | 6 | 12 | 19 |
| Entertainment | 11 | 16 | 23 |
| Food & Beverage | 10 | 15 | 21 |
| Education | 8 | 12 | 17 |
| Real Estate | 7 | 13 | 20 |


