Free US Advertiser Spending Efficiency by Channel from 2020 to 2025 Chart
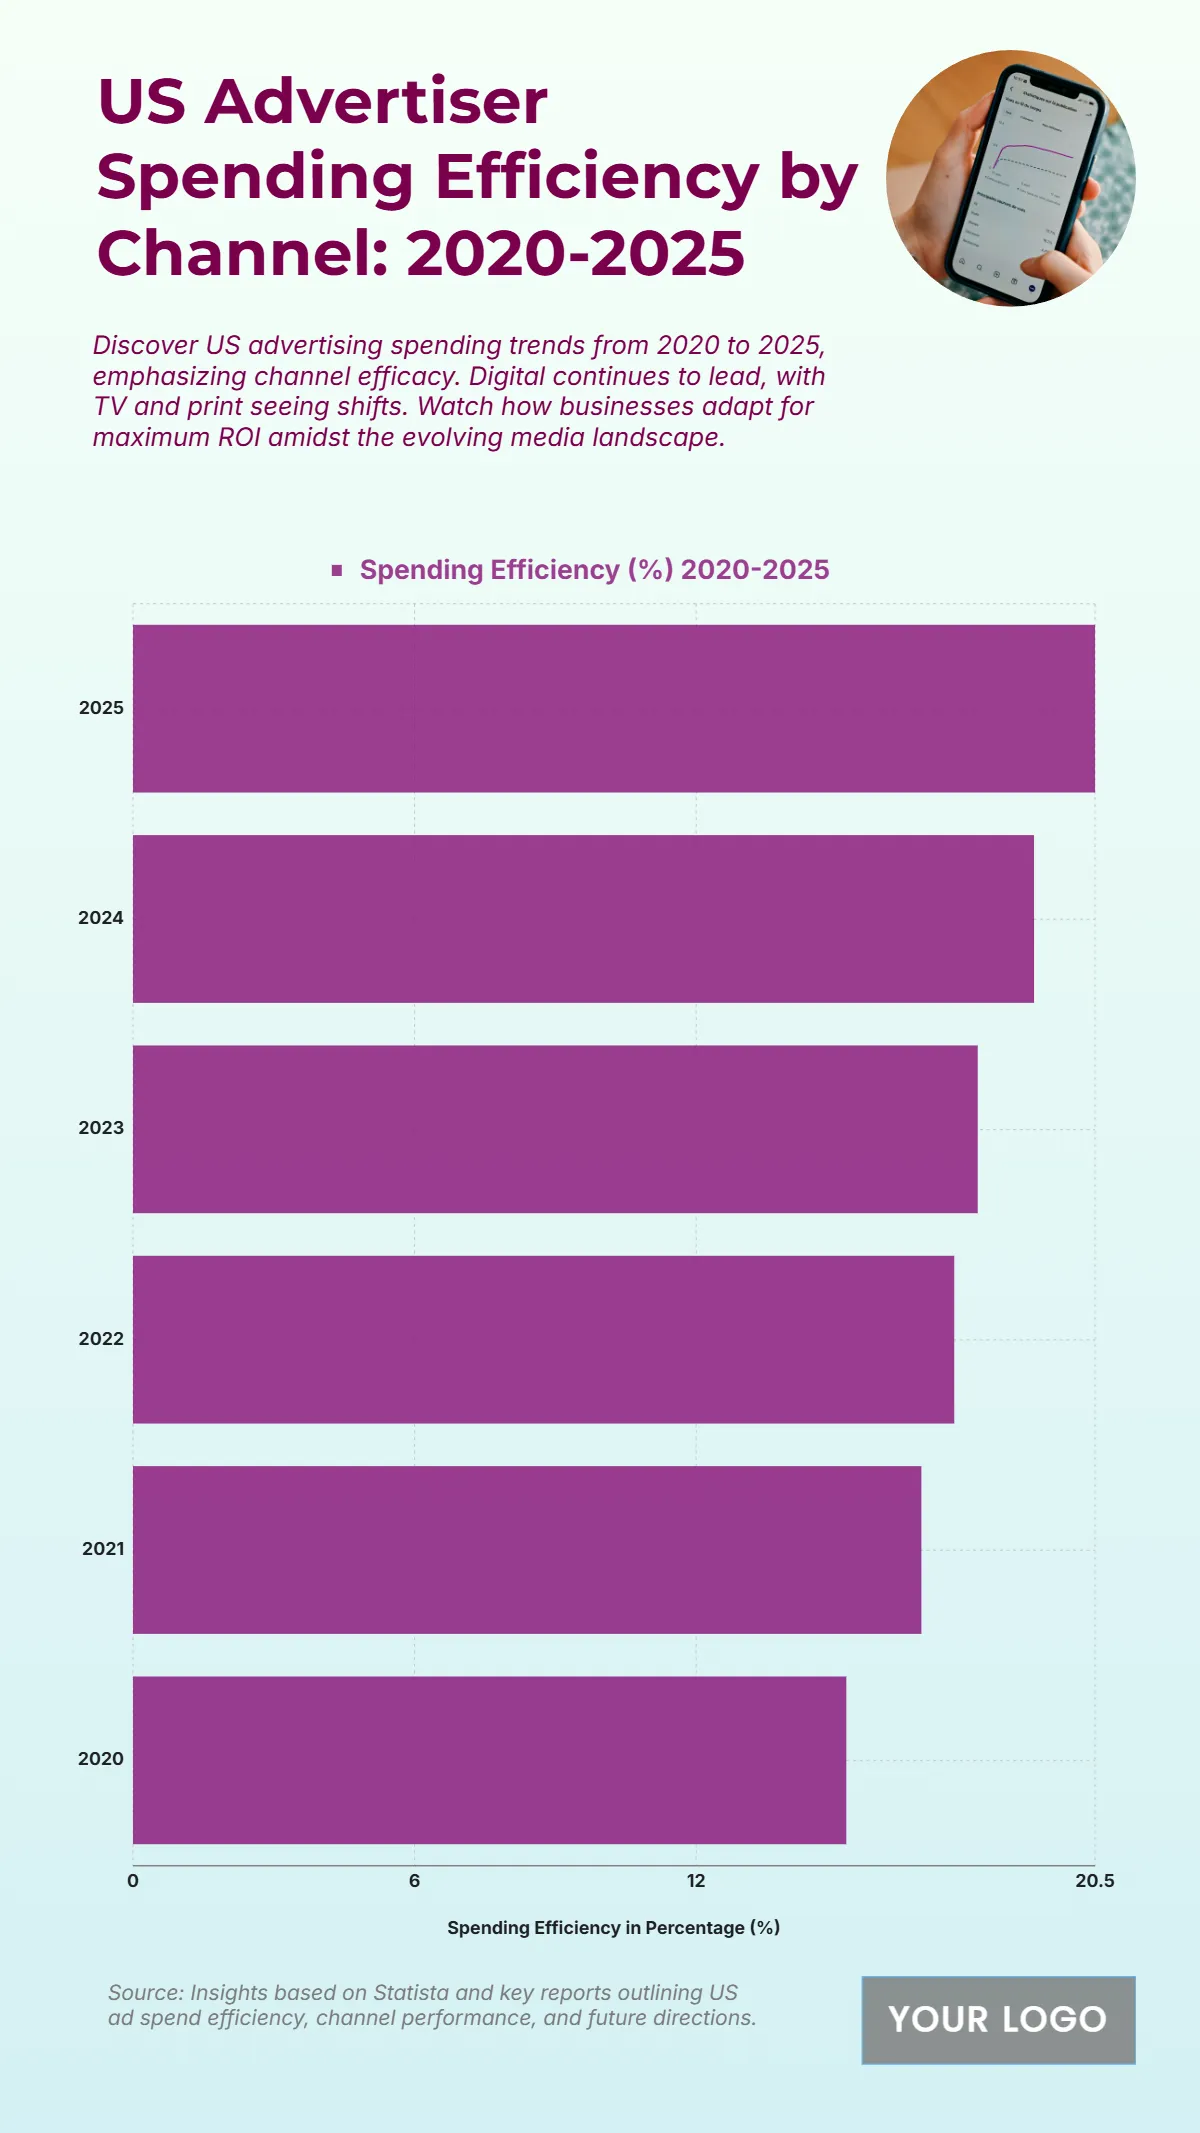
The chart displays a consistent improvement in U.S. advertiser spending efficiency from 2020 to 2025, underscoring how brands are optimizing their marketing budgets across channels. Efficiency levels rose steadily from 15.2% in 2020 to 20.5% in 2025, marking a 5.3 percentage-point increase over the five-year period. The upward trend highlights the shift toward digital-first strategies, automation, and data-driven advertising that enhance ROI. By 2021, spending efficiency reached 16.8%, and it continued climbing through 17.5% in 2022 and 18% in 2023, reflecting growing precision in ad targeting. The jump to 19.2% in 2024 and 20.5% in 2025 emphasizes improved campaign management and analytics, showcasing advertisers’ ability to balance cost and performance effectively. Overall, the data illustrates the industry’s evolution toward more sustainable, performance-based advertising practices, optimizing returns while minimizing wasteful expenditure.
| Labels | Spending Efficiency (%) 2020–2025 |
|---|---|
| 2025 | 20.5 |
| 2024 | 19.2 |
| 2023 | 18 |
| 2022 | 17.5 |
| 2021 | 16.8 |
| 2020 | 15.2 |


