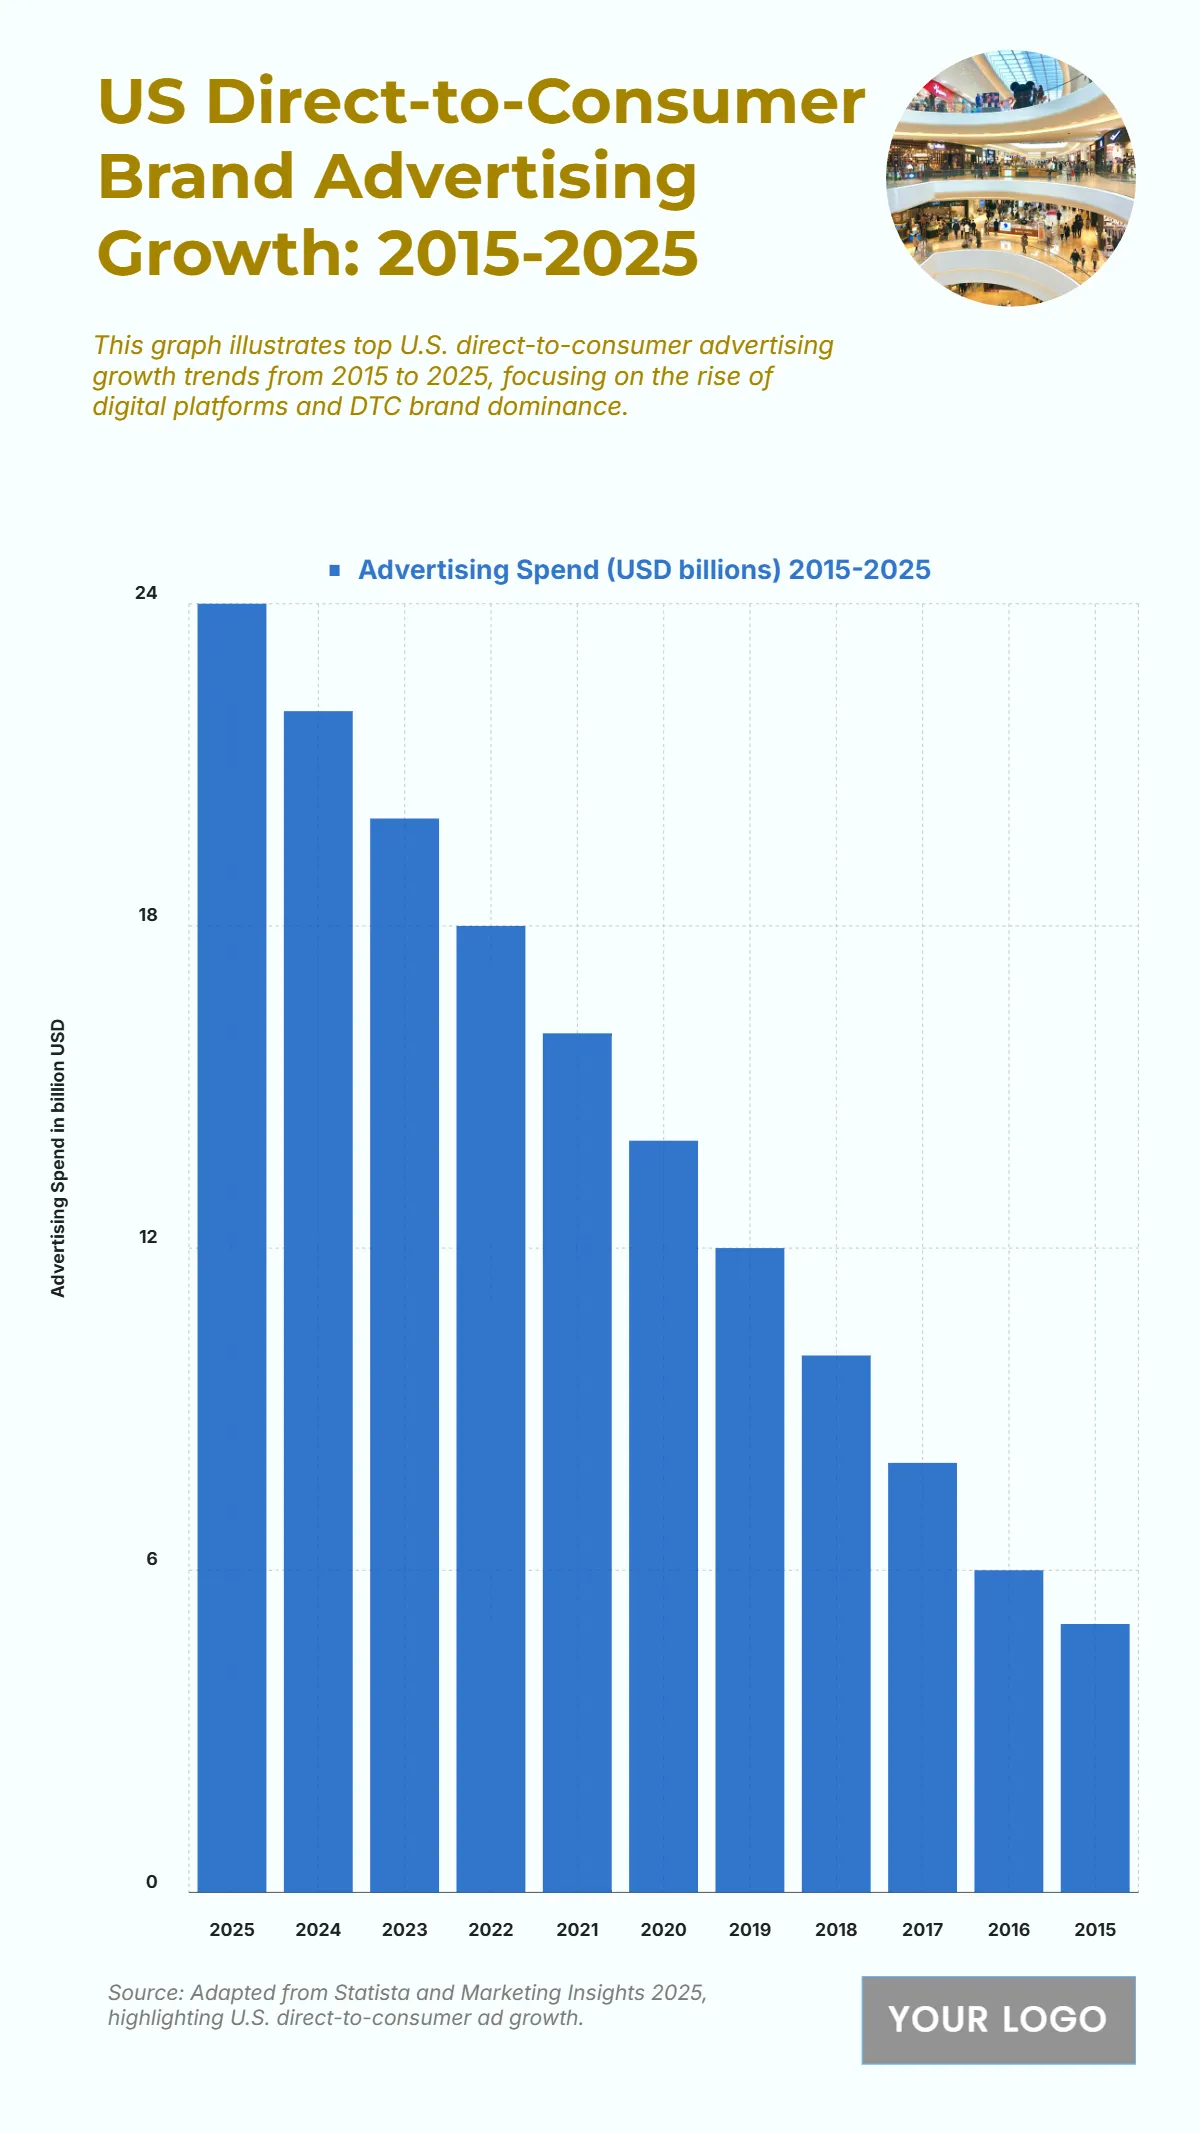
Free US Direct-to-Consumer Brand Advertising Growth from 2015 to 2025 Chart
The chart presents the continuous increase in U.S. direct-to-consumer (DTC) brand advertising spending from 2015 to 2025, highlighting how digital transformation fuels marketing growth. Spending expanded significantly from $5 billion in 2015 to a projected $24 billion by 2025, marking nearly a fivefold rise in just a decade. This upward trend reflects the dominance of e-commerce, social media marketing, and influencer-driven strategies that directly engage consumers. By 2018, spending reached $10 billion, followed by steady increases to $14 billion in 2020 and $18 billion in 2022, emphasizing brands’ growing focus on direct online relationships and data-based personalization. The latest projections show $22 billion in 2024 and $24 billion in 2025, indicating the strong resilience and profitability of DTC advertising models. Overall, the data underscores how direct engagement strategies have become central to U.S. brand marketing, aligning with consumer demand for convenience and authenticity.
| Labels | Advertising Spend (USD billions) 2015–2025 |
|---|---|
| 2025 | 24 |
| 2024 | 22 |
| 2023 | 20 |
| 2022 | 18 |
| 2021 | 16 |
| 2020 | 14 |
| 2019 | 12 |
| 2018 | 10 |
| 2017 | 8 |
| 2016 | 6 |
| 2015 | 5 |


