Free US Ad Revenue Distribution by Campaign Objective from 2020 to 2025 Chart
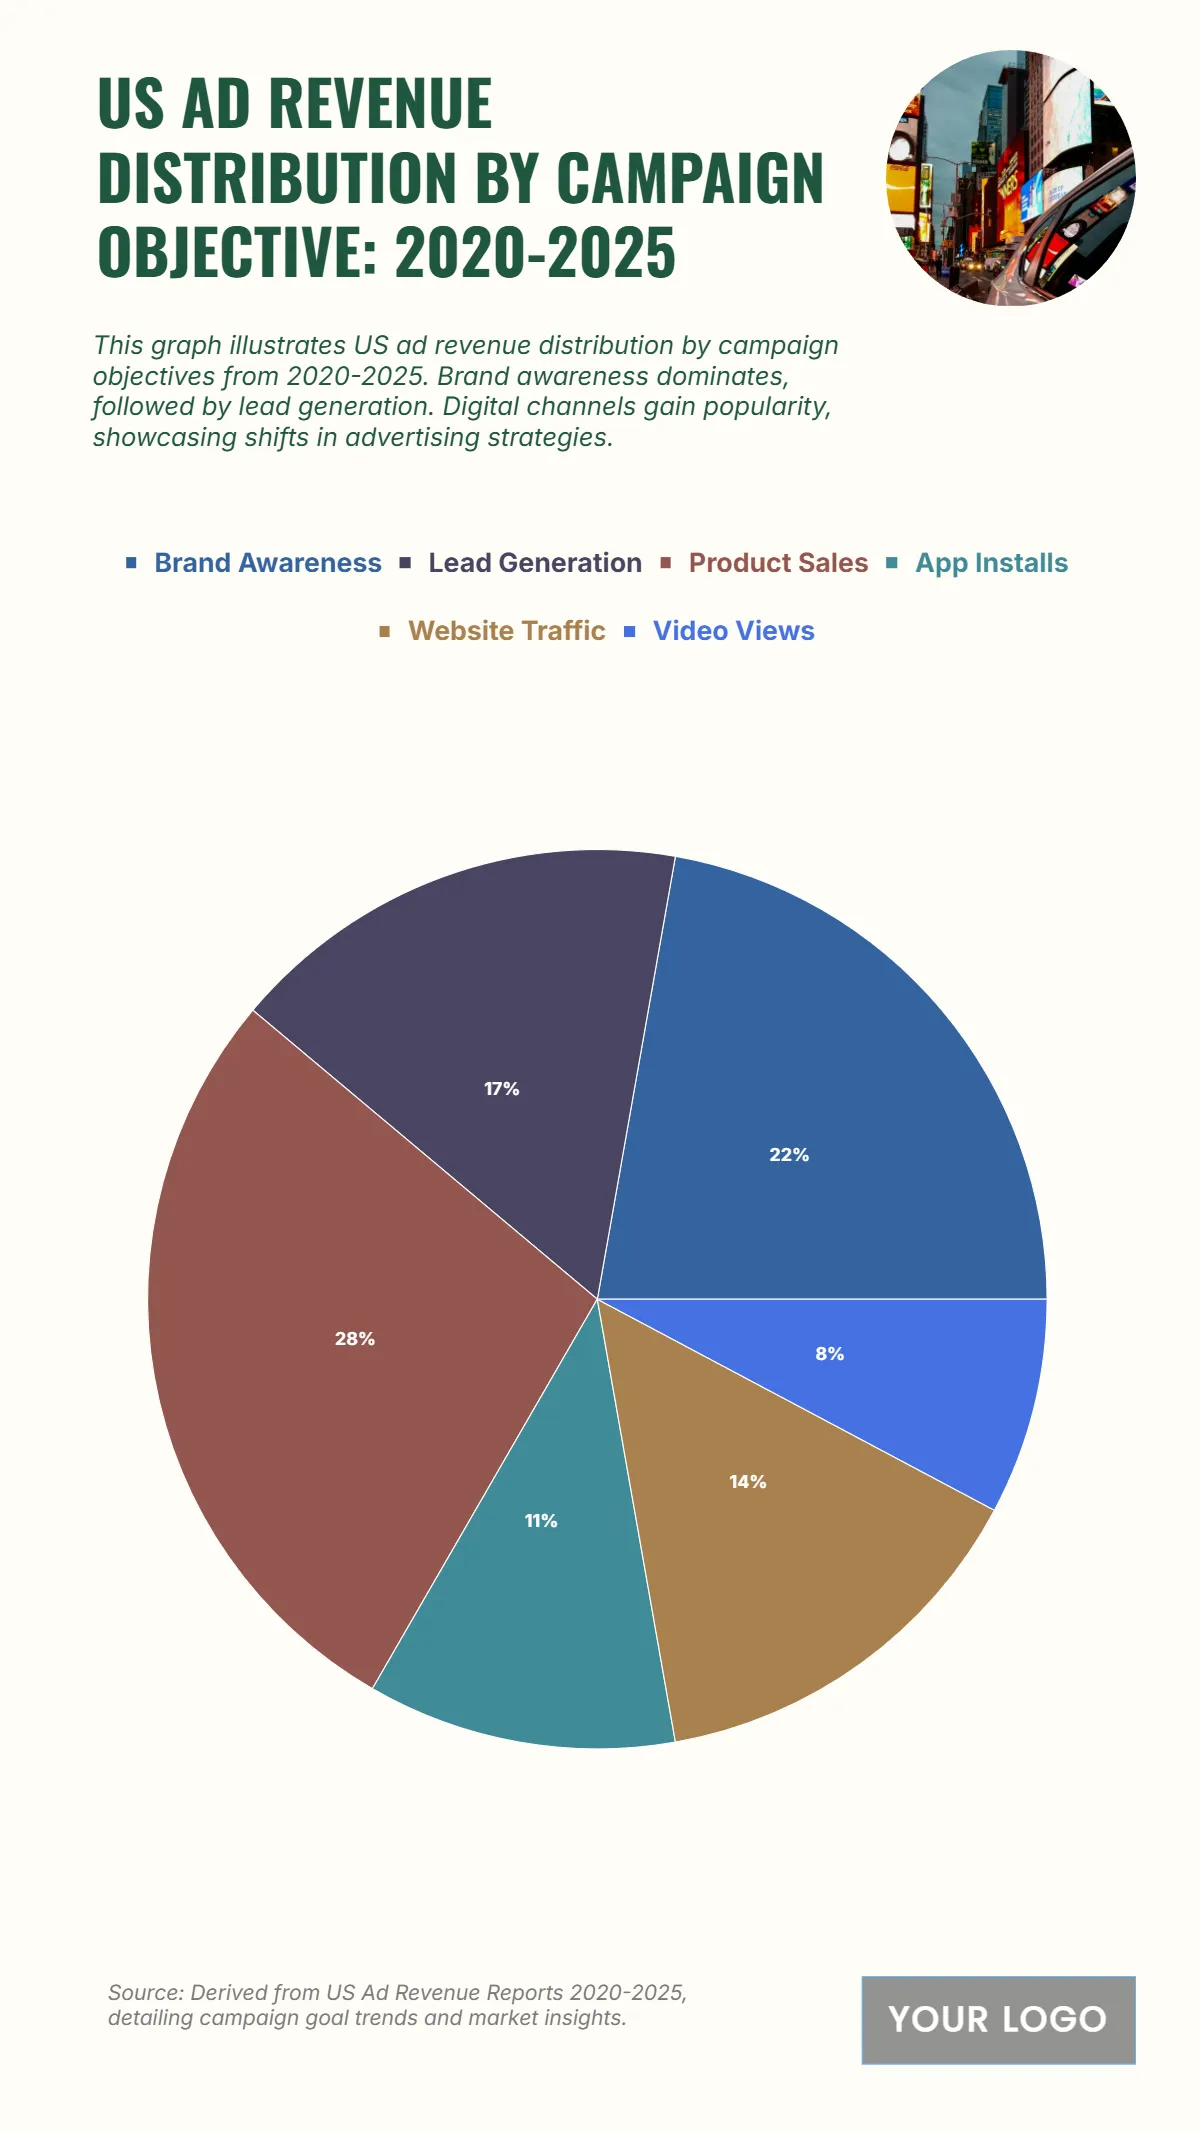
The chart shows the US ad revenue distribution by campaign objective from 2020 to 2025, revealing that Product Sales generate the highest revenue at $25 million (38%), highlighting the dominance of direct sales campaigns. Brand Awareness follows with $20 million (32%), showing continued investment in building brand presence across markets. Lead Generation contributes $15 million (14%), reflecting a steady focus on customer acquisition strategies. Website Traffic reaches $13 million (11%), while App Installs total $10 million (8%), indicating moderate emphasis on digital user engagement. Lastly, Video Views account for $7 million (17%), emphasizing growing interest in multimedia advertising formats. The overall data suggests a strategic balance between performance-driven campaigns and long-term brand-building, underscoring the evolving dynamics of the US advertising landscape toward integrated digital engagement and measurable outcomes.
| Labels | 2020–2025 Revenue (in millions) |
|---|---|
| Brand Awareness | 20 |
| Lead Generation | 15 |
| Product Sales | 25 |
| App Installs | 10 |
| Website Traffic | 13 |
| Video Views | 7 |


