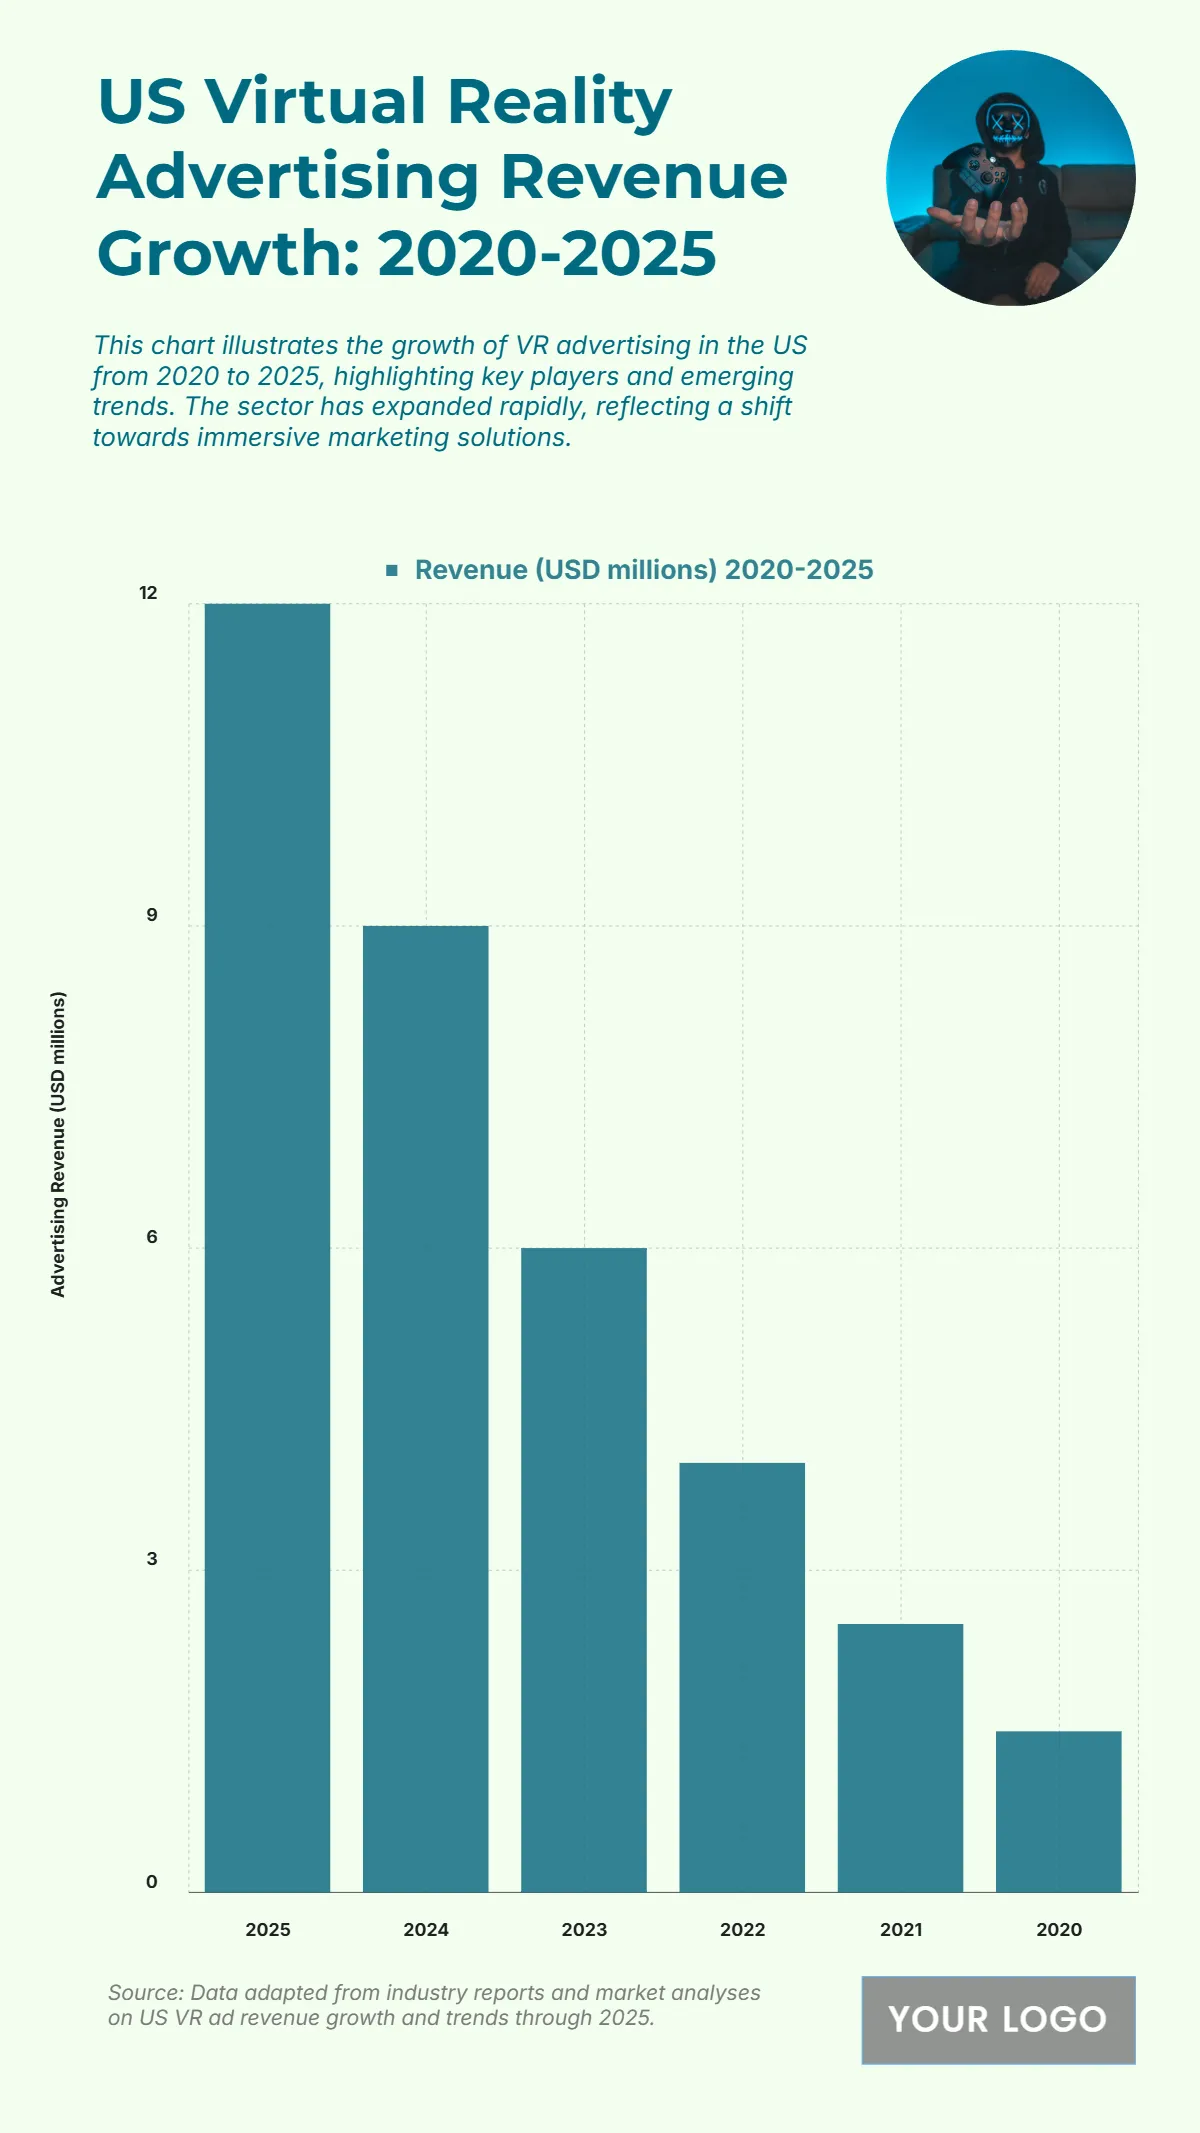
Free US Virtual Reality Advertising Revenue Growth from 2020 to 2025 Chart
The chart highlights the consistent growth of virtual reality (VR) advertising revenue in the US from 2020 to 2025, emphasizing the sector’s rapid expansion and increasing market adoption. Starting at $1.5 million in 2020, revenue steadily climbs to $2.5 million in 2021 and $4 million in 2022, reflecting rising investments in immersive marketing technologies. By 2023, the revenue reaches $6 million, showcasing the technology’s growing integration in advertising strategies. The momentum accelerates further in 2024, reaching $9 million, and peaks at $12 million in 2025, signifying a strong market shift toward VR-based engagement and brand experiences. Overall, the data demonstrates a more than sevenfold increase over five years, reinforcing VR’s role as a transformative medium in the future of digital advertising and marketing innovation.
| Labels | Revenue (USD millions) 2020–2025 |
|---|---|
| 2025 | 12 |
| 2024 | 9 |
| 2023 | 6 |
| 2022 | 4 |
| 2021 | 2.5 |
| 2020 | 1.5 |


