Free US Political TV Advertising Spending from 2015 to 2025 Chart
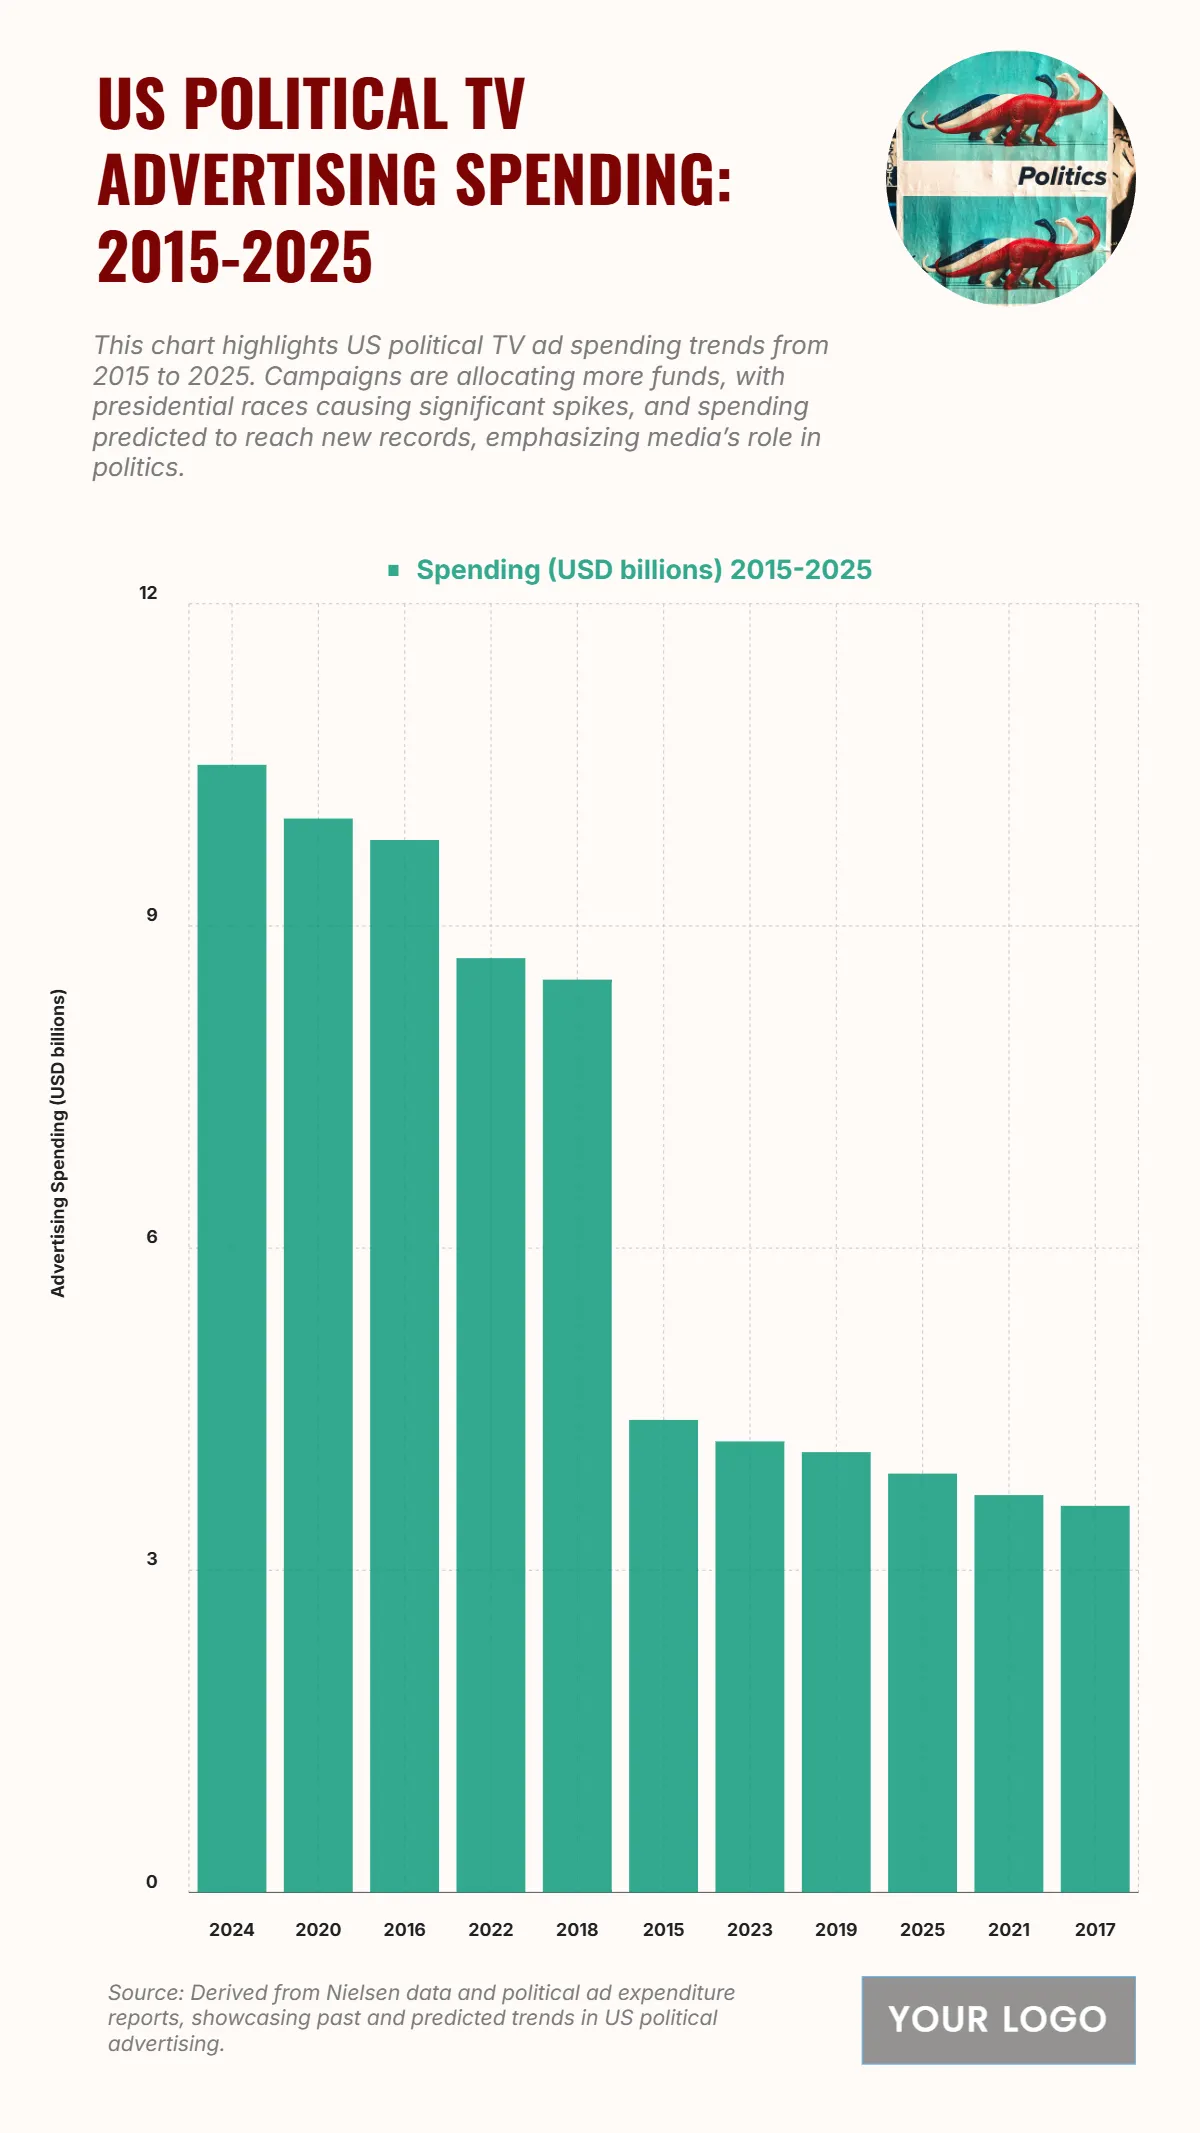
The chart shows the US political TV advertising spending from 2015 to 2025, revealing fluctuations tied to major election years. The highest expenditure occurs in 2024 at $10.5 billion, driven by presidential campaign activity, followed by 2020 at $10 billion and 2016 at $9.8 billion, also marking election cycles. Spending dips slightly to $8.7 billion in 2022 and $8.5 billion in 2018, maintaining strong momentum during midterm elections. In contrast, non-election years reflect a notable decline, with $4.4 billion in 2015, $4.2 billion in 2023, and $4.1 billion in 2019. The lowest figures appear in 2025 ($3.9 billion), 2021 ($3.7 billion), and 2017 ($3.6 billion), underscoring predictable lulls between political races. Overall, the data underscores the cyclical nature of political ad spending, where presidential election years fuel significant spikes, reinforcing television’s enduring influence in political campaigning and voter outreach.
| Labels | Spending (USD billions) 2015–2025 |
|---|---|
| 2024 | 10.5 |
| 2020 | 10 |
| 2016 | 9.8 |
| 2022 | 8.7 |
| 2018 | 8.5 |
| 2015 | 4.4 |
| 2023 | 4.2 |
| 2019 | 4.1 |
| 2025 | 3.9 |
| 2021 | 3.7 |
| 2017 | 3.6 |


