Free US Multi-Channel Campaign ROI by Industry from 2020 to 2025 Chart
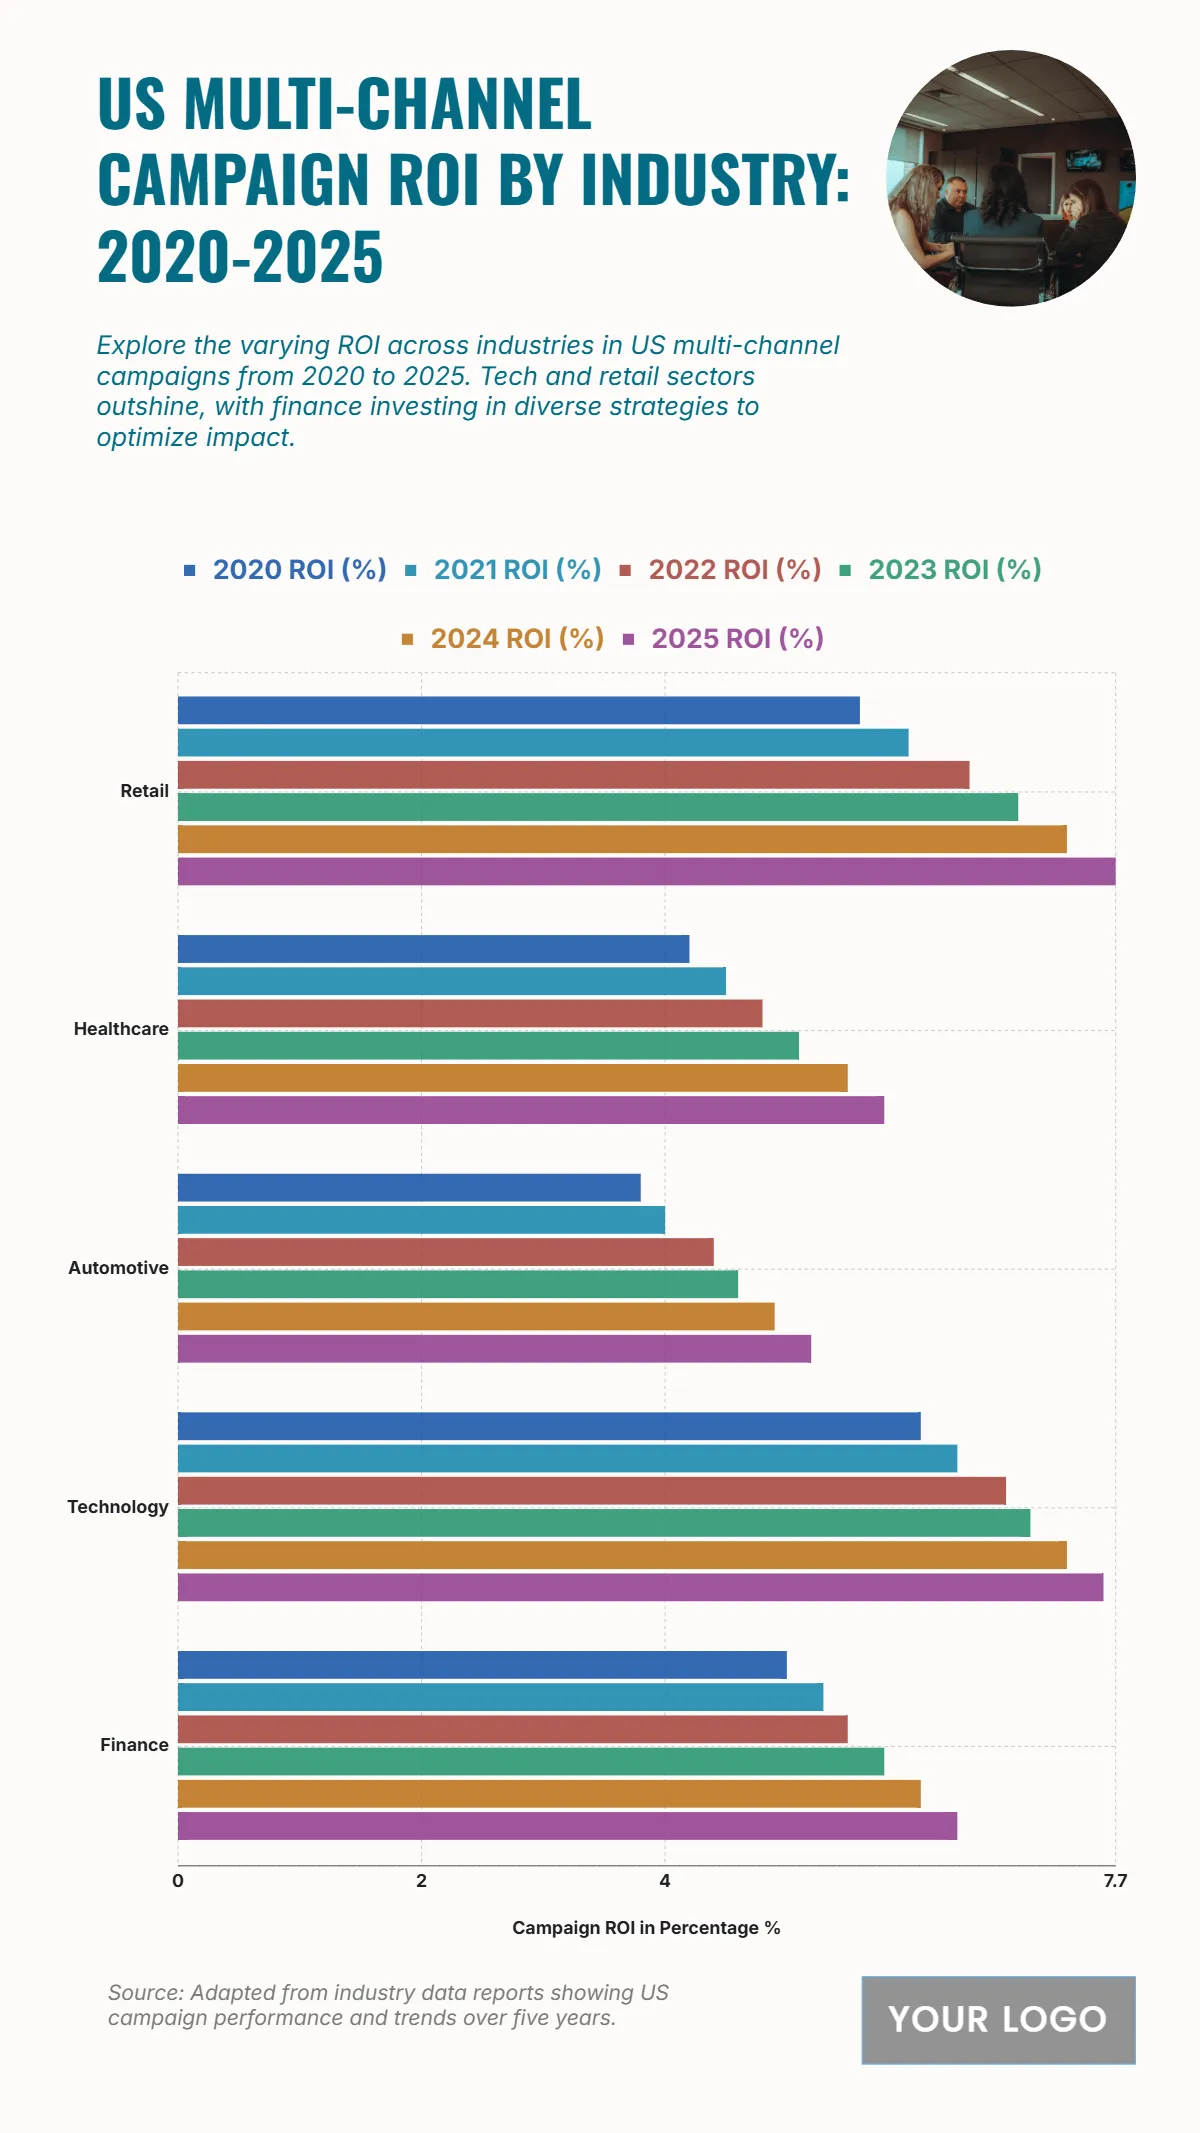
The chart presents the multi-channel campaign ROI across major US industries from 2020 to 2025, showing consistent growth across all sectors. Retail maintains the highest returns, rising from 5.6% in 2020 to 7.7% in 2025, reflecting strong consumer engagement and e-commerce growth. Technology follows closely, increasing from 6.1% to 7.6%, driven by innovation and digital transformation. Finance sees steady progress from 5% to 6.4%, supported by data-driven marketing and fintech expansion. Healthcare improves from 4.2% to 5.8%, highlighting increased digital outreach and health awareness campaigns. Meanwhile, Automotive records modest growth from 3.8% in 2020 to 5.2% in 2025, indicating gradual adaptation to digital marketing trends. Overall, the upward trajectory across all industries signifies a positive shift in cross-platform campaign efficiency, emphasizing how technology and data analytics continue to enhance return on investment in multi-channel strategies.
| Labels | 2020 ROI (%) | 2021 ROI (%) | 2022 ROI (%) | 2023 ROI (%) | 2024 ROI (%) | 2025 ROI (%) |
|---|---|---|---|---|---|---|
| Retail | 5.6 | 6.0 | 6.5 | 6.9 | 7.3 | 7.7 |
| Healthcare | 4.2 | 4.5 | 4.8 | 5.1 | 5.5 | 5.8 |
| Automotive | 3.8 | 4.0 | 4.4 | 4.6 | 4.9 | 5.2 |
| Technology | 6.1 | 6.4 | 6.8 | 7.0 | 7.3 | 7.6 |
| Finance | 5.0 | 5.3 | 5.5 | 5.8 | 6.1 | 6.4 |


