Free US Sports Sponsorship Advertising Spend from 2015 to 2025 Chart
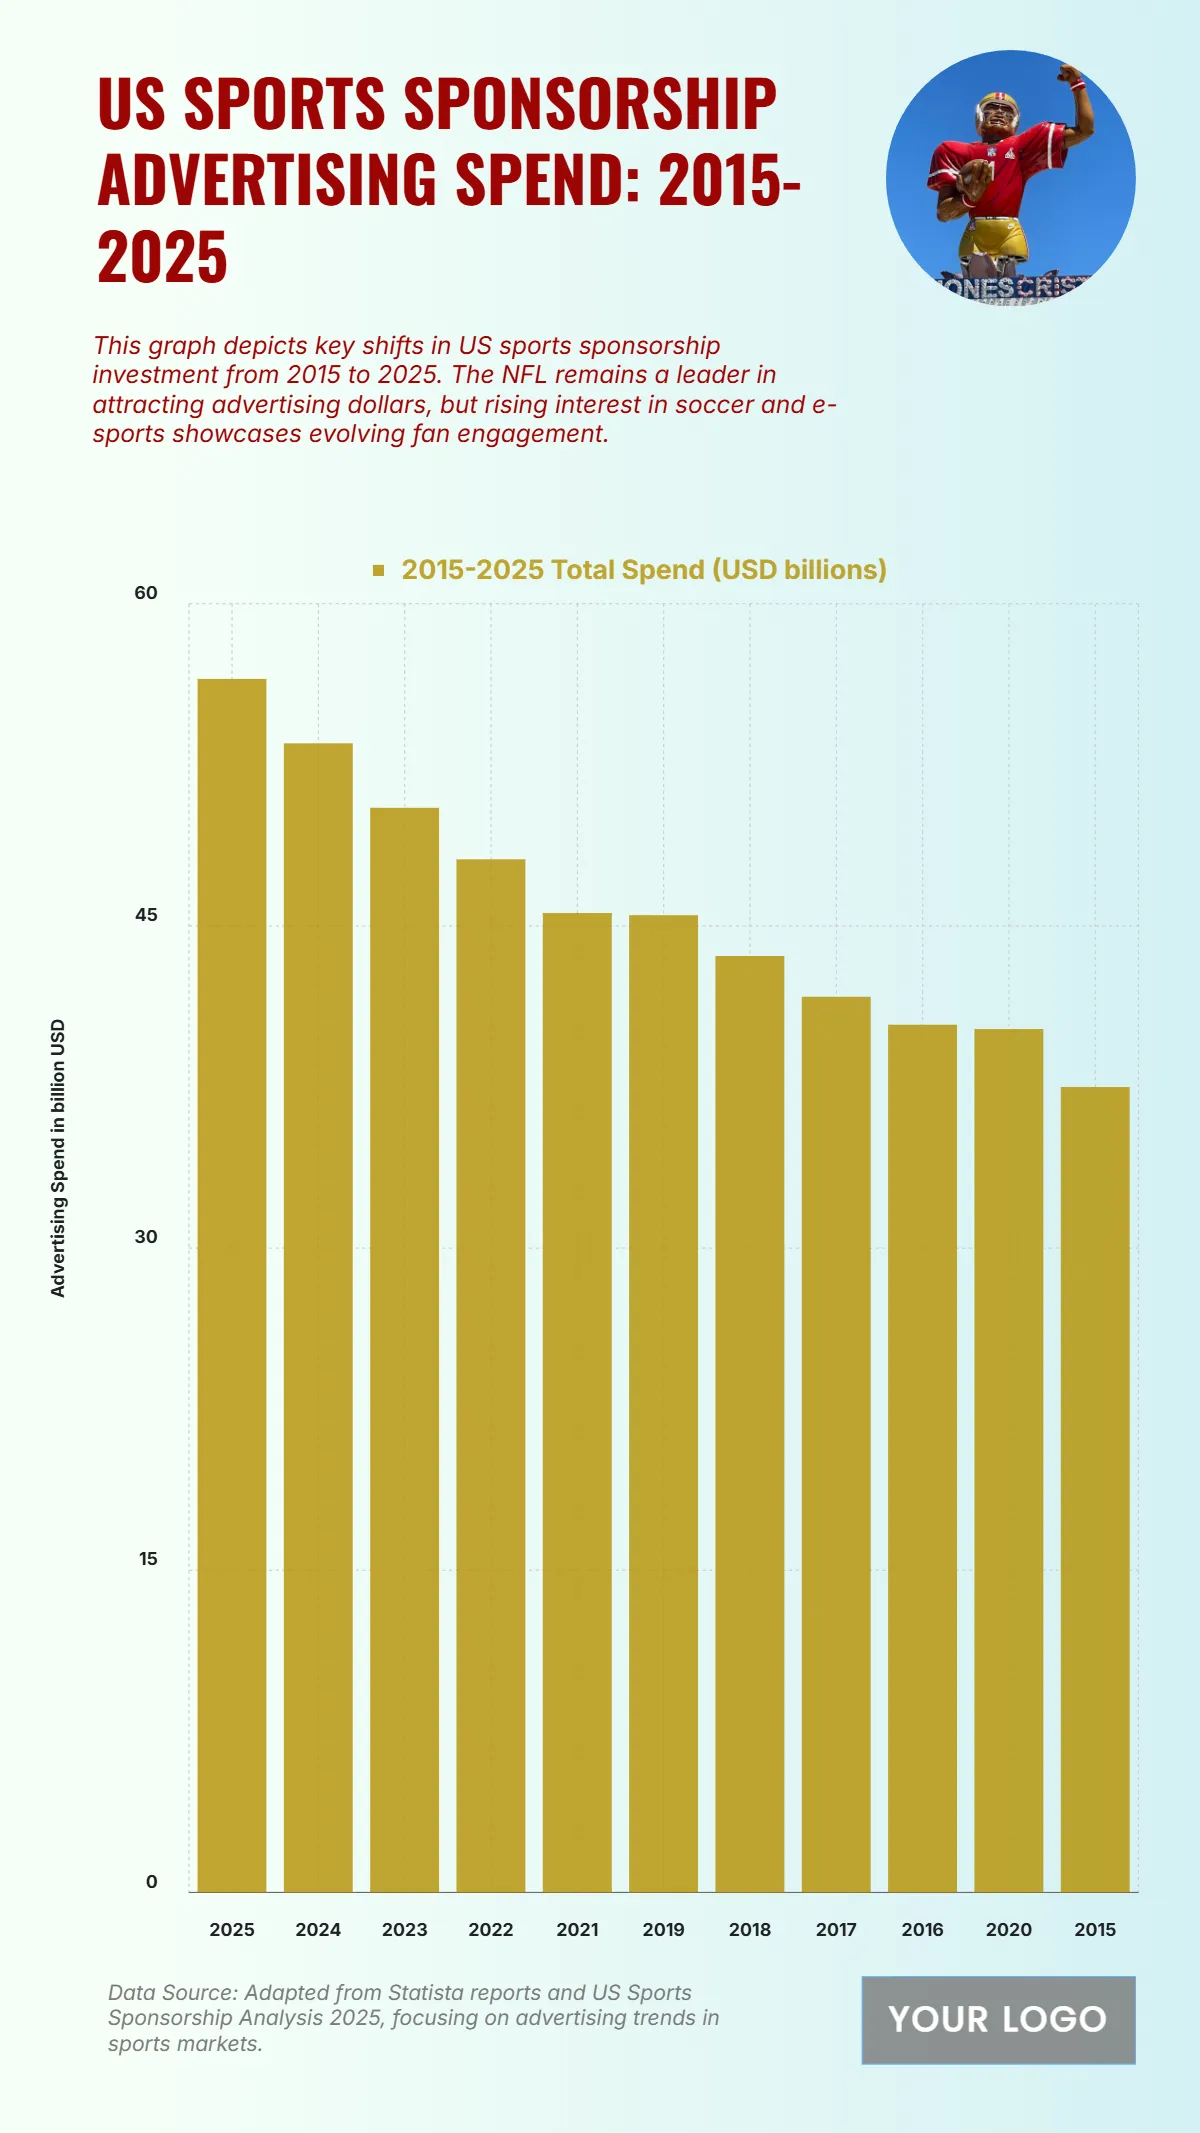
The chart illustrates the US sports sponsorship advertising spend from 2015 to 2025, showcasing a steady upward trend in investment over the decade. Spending grows significantly from $37.5 billion in 2015 to a projected $56.5 billion in 2025, highlighting the strong commercial appeal of sports in driving brand visibility. The data shows consistent increases through $40.4 billion in 2016, $43.6 billion in 2018, and $45.6 billion in 2021, with major spikes during 2023 ($50.5 billion) and 2024 ($53.5 billion) as sports events and digital sponsorships expand. The NFL remains a dominant driver, while soccer and e-sports continue to attract growing advertising interest. Overall, the rising sponsorship spend reflects the evolving engagement strategies and growing monetization of sports entertainment, emphasizing brands’ commitment to immersive fan experiences and diversified marketing through live and digital sports platforms.
| Labels | 2015–2025 Total Spend (USD billions) |
|---|---|
| 2025 | 56.5 |
| 2024 | 53.5 |
| 2023 | 50.5 |
| 2022 | 48.1 |
| 2021 | 45.6 |
| 2019 | 45.5 |
| 2018 | 43.6 |
| 2017 | 41.7 |
| 2016 | 40.4 |
| 2020 | 40.2 |
| 2015 | 37.5 |


