Free US Mobile Video Ad Engagement Rates from 2020 to 2025 Chart
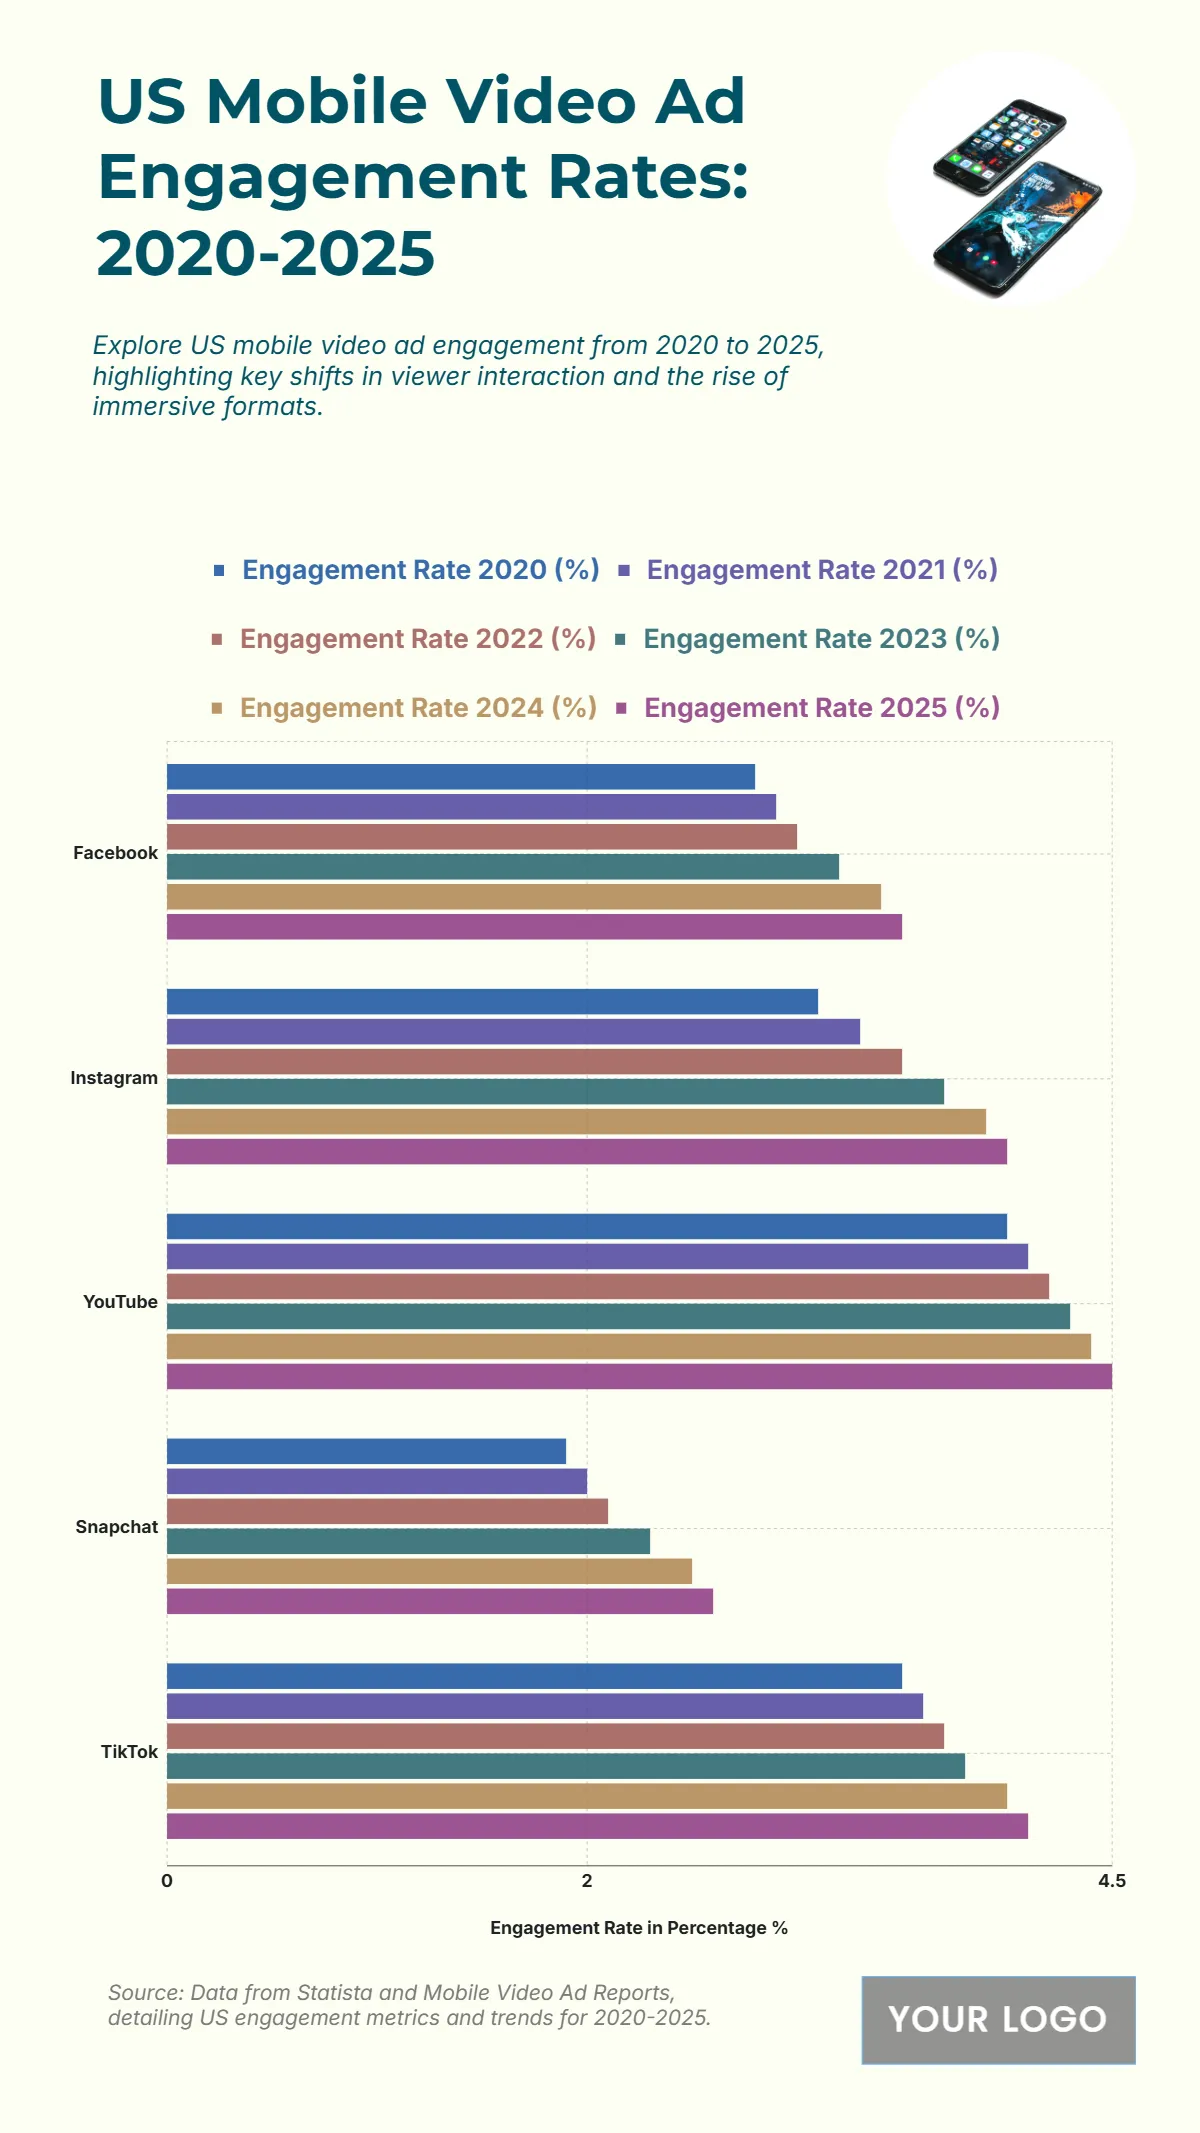
The chart highlights the US mobile video ad engagement rates from 2020 to 2025, showcasing the upward trend across major social platforms as short-form and immersive content continue to dominate. YouTube leads consistently, increasing from 4% in 2020 to 4.5% in 2025, reflecting strong viewer interaction with video ads. TikTok follows closely, climbing from 3.5% to 4.1%, driven by its viral and interactive ad formats. Instagram demonstrates steady growth from 3.1% to 4%, emphasizing its effectiveness in connecting brands with visually engaged audiences. Facebook rises moderately from 2.8% to 3.5%, maintaining relevance among diverse demographics, while Snapchat records the lowest but consistent increase from 1.9% to 2.6%, reflecting its niche user engagement. Overall, the data underscores a shift toward video-first mobile advertising, where social platforms leverage creative and personalized video formats to enhance user interaction and retention rates.
| Labels | Engagement Rate 2020 (%) | Engagement Rate 2021 (%) | Engagement Rate 2022 (%) | Engagement Rate 2023 (%) | Engagement Rate 2024 (%) | Engagement Rate 2025 (%) |
|---|---|---|---|---|---|---|
| 2.8 | 2.9 | 3.0 | 3.2 | 3.4 | 3.5 | |
| 3.1 | 3.3 | 3.5 | 3.7 | 3.9 | 4.0 | |
| YouTube | 4.0 | 4.1 | 4.2 | 4.3 | 4.4 | 4.5 |
| Snapchat | 1.9 | 2.0 | 2.1 | 2.3 | 2.5 | 2.6 |
| TikTok | 3.5 | 3.6 | 3.7 | 3.8 | 4.0 | 4.1 |


