Free US Advertising Revenue Share by Content Type from 2015 to 2025 Chart
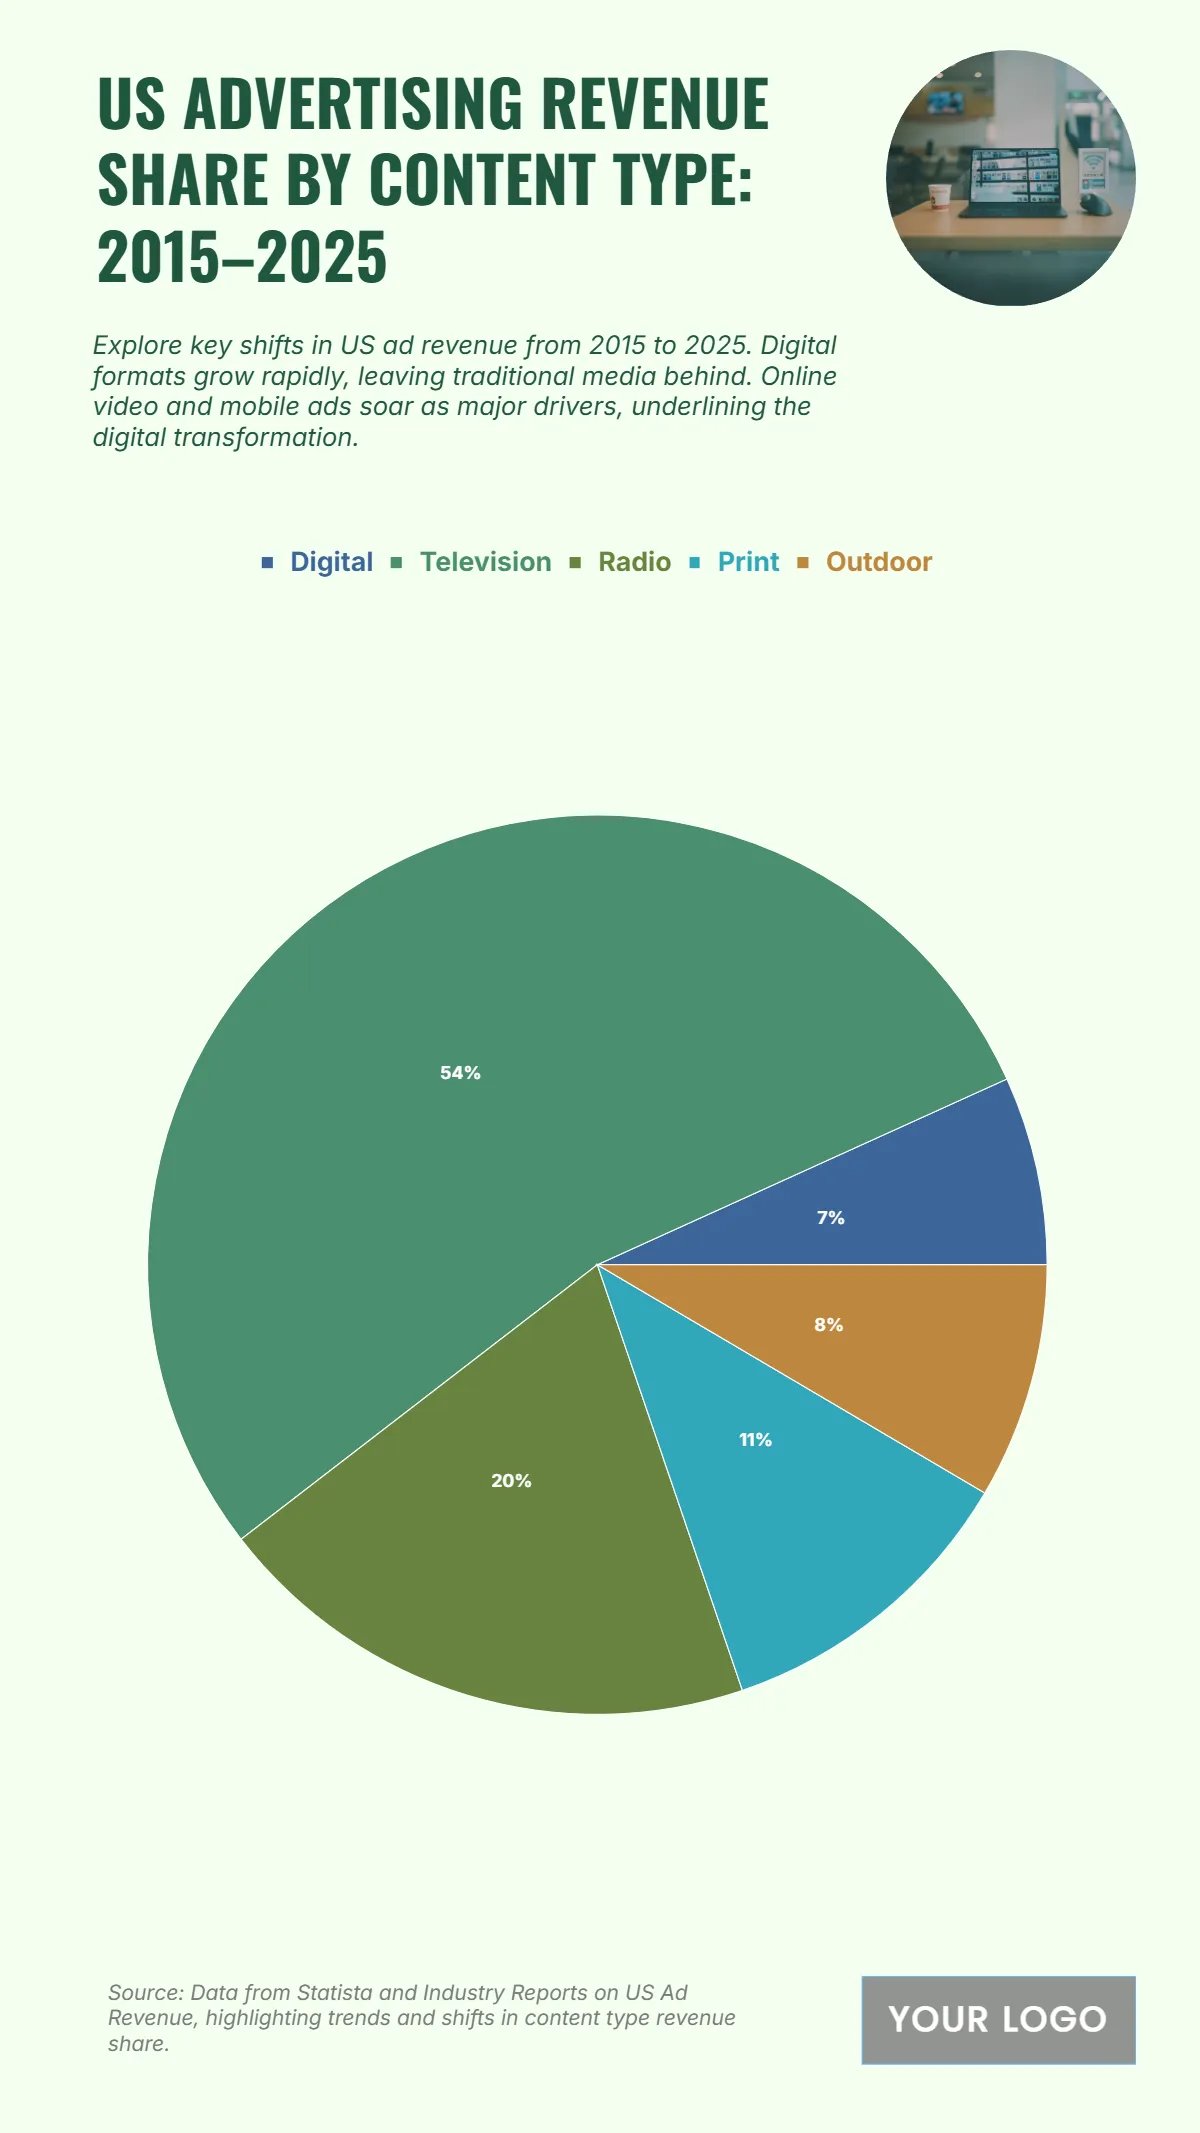
The chart illustrates the US advertising revenue share by content type from 2015 to 2025, highlighting the continued dominance of traditional media alongside the rapid rise of digital formats. Television leads with $95 million (38%), remaining a key driver of ad revenue through mass reach and brand influence. Digital advertising follows with $42 million (42%), marking a significant leap fueled by online video, mobile, and social platforms. Radio generates $35 million (12%), maintaining stability through regional and demographic targeting. Print media accounts for $20 million (7%), showing a gradual decline due to digital transformation, while Outdoor advertising contributes $15 million (5%), supported by digital billboards and experiential campaigns. Overall, the data underscores a paradigm shift toward digital-first strategies, as advertisers increasingly prioritize online engagement and cross-platform integration to capture evolving consumer behavior.
| Labels | 2015–2025 Revenue Share (in $ millions) |
|---|---|
| Digital | 42 |
| Television | 95 |
| Radio | 35 |
| 20 | |
| Outdoor | 15 |


