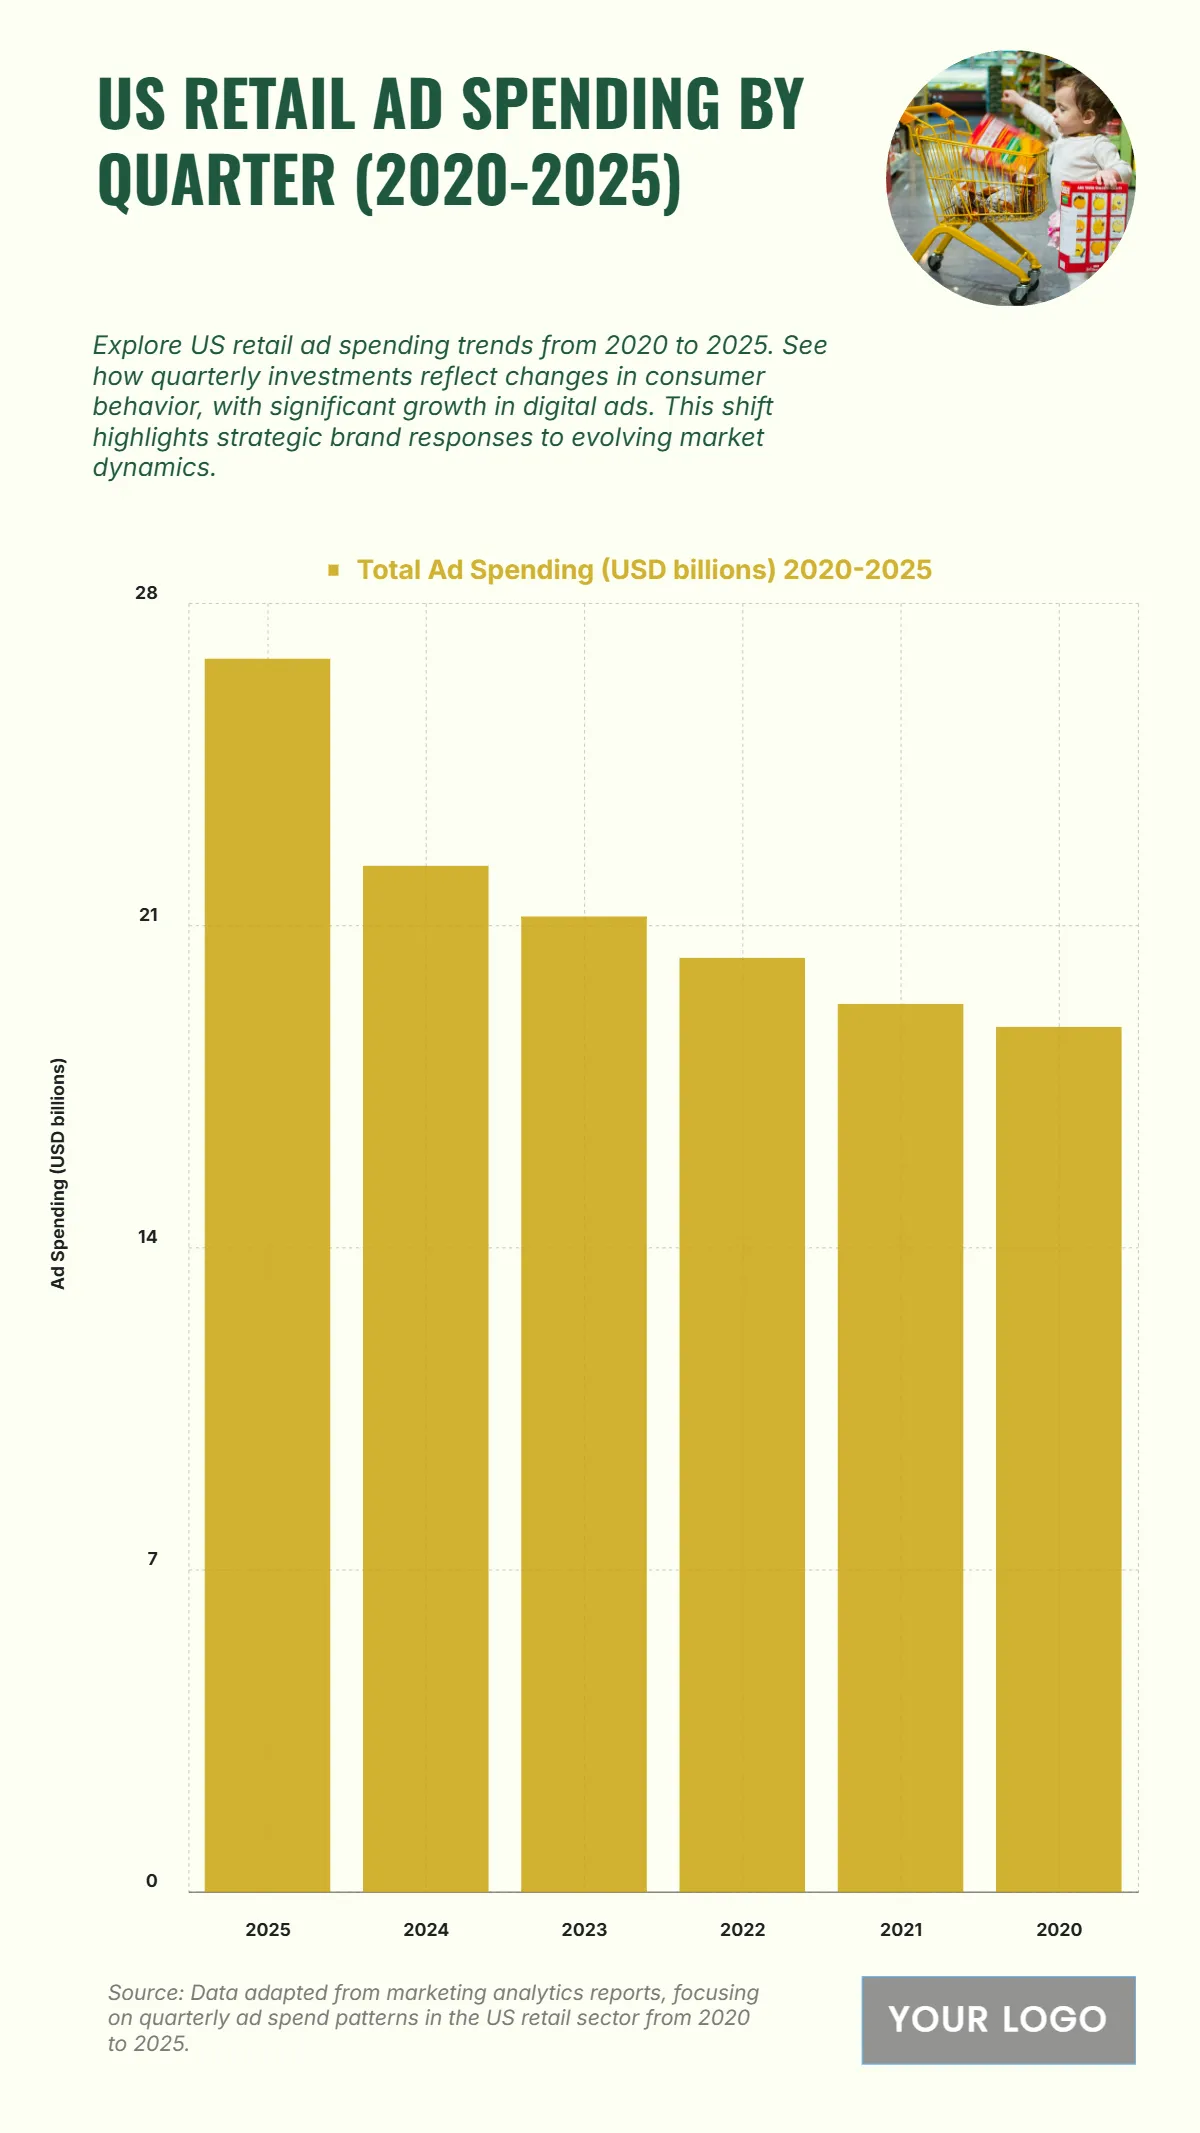
Free US Retail Ad Spending by Quarter from 2020 to 2025 Chart
The chart presents the US retail ad spending by quarter from 2020 to 2025, highlighting a steady increase in advertising investment as the market adapts to evolving consumer behaviors and digital trends. Total ad spending grows from $18.8 billion in 2020 to $19.3 billion in 2021, showing early post-pandemic recovery and renewed marketing confidence. Spending continues to rise moderately, reaching $20.3 billion in 2022 and $21.2 billion in 2023, reflecting a consistent upward trajectory. By 2024, ad investment jumps to $22.3 billion, and peaks in 2025 at $26.8 billion, signaling strong retail momentum driven by e-commerce and omnichannel strategies. The data emphasizes how brands increasingly allocate higher budgets to maintain competitive visibility and adapt to shifting purchasing behaviors, underscoring the retail sector’s resilience and digital transformation through sustained advertising growth.
| Labels | Total Ad Spending (USD billions) 2020–2025 |
|---|---|
| 2025 | 26.8 |
| 2024 | 22.3 |
| 2023 | 21.2 |
| 2022 | 20.3 |
| 2021 | 19.3 |
| 2020 | 18.8 |


