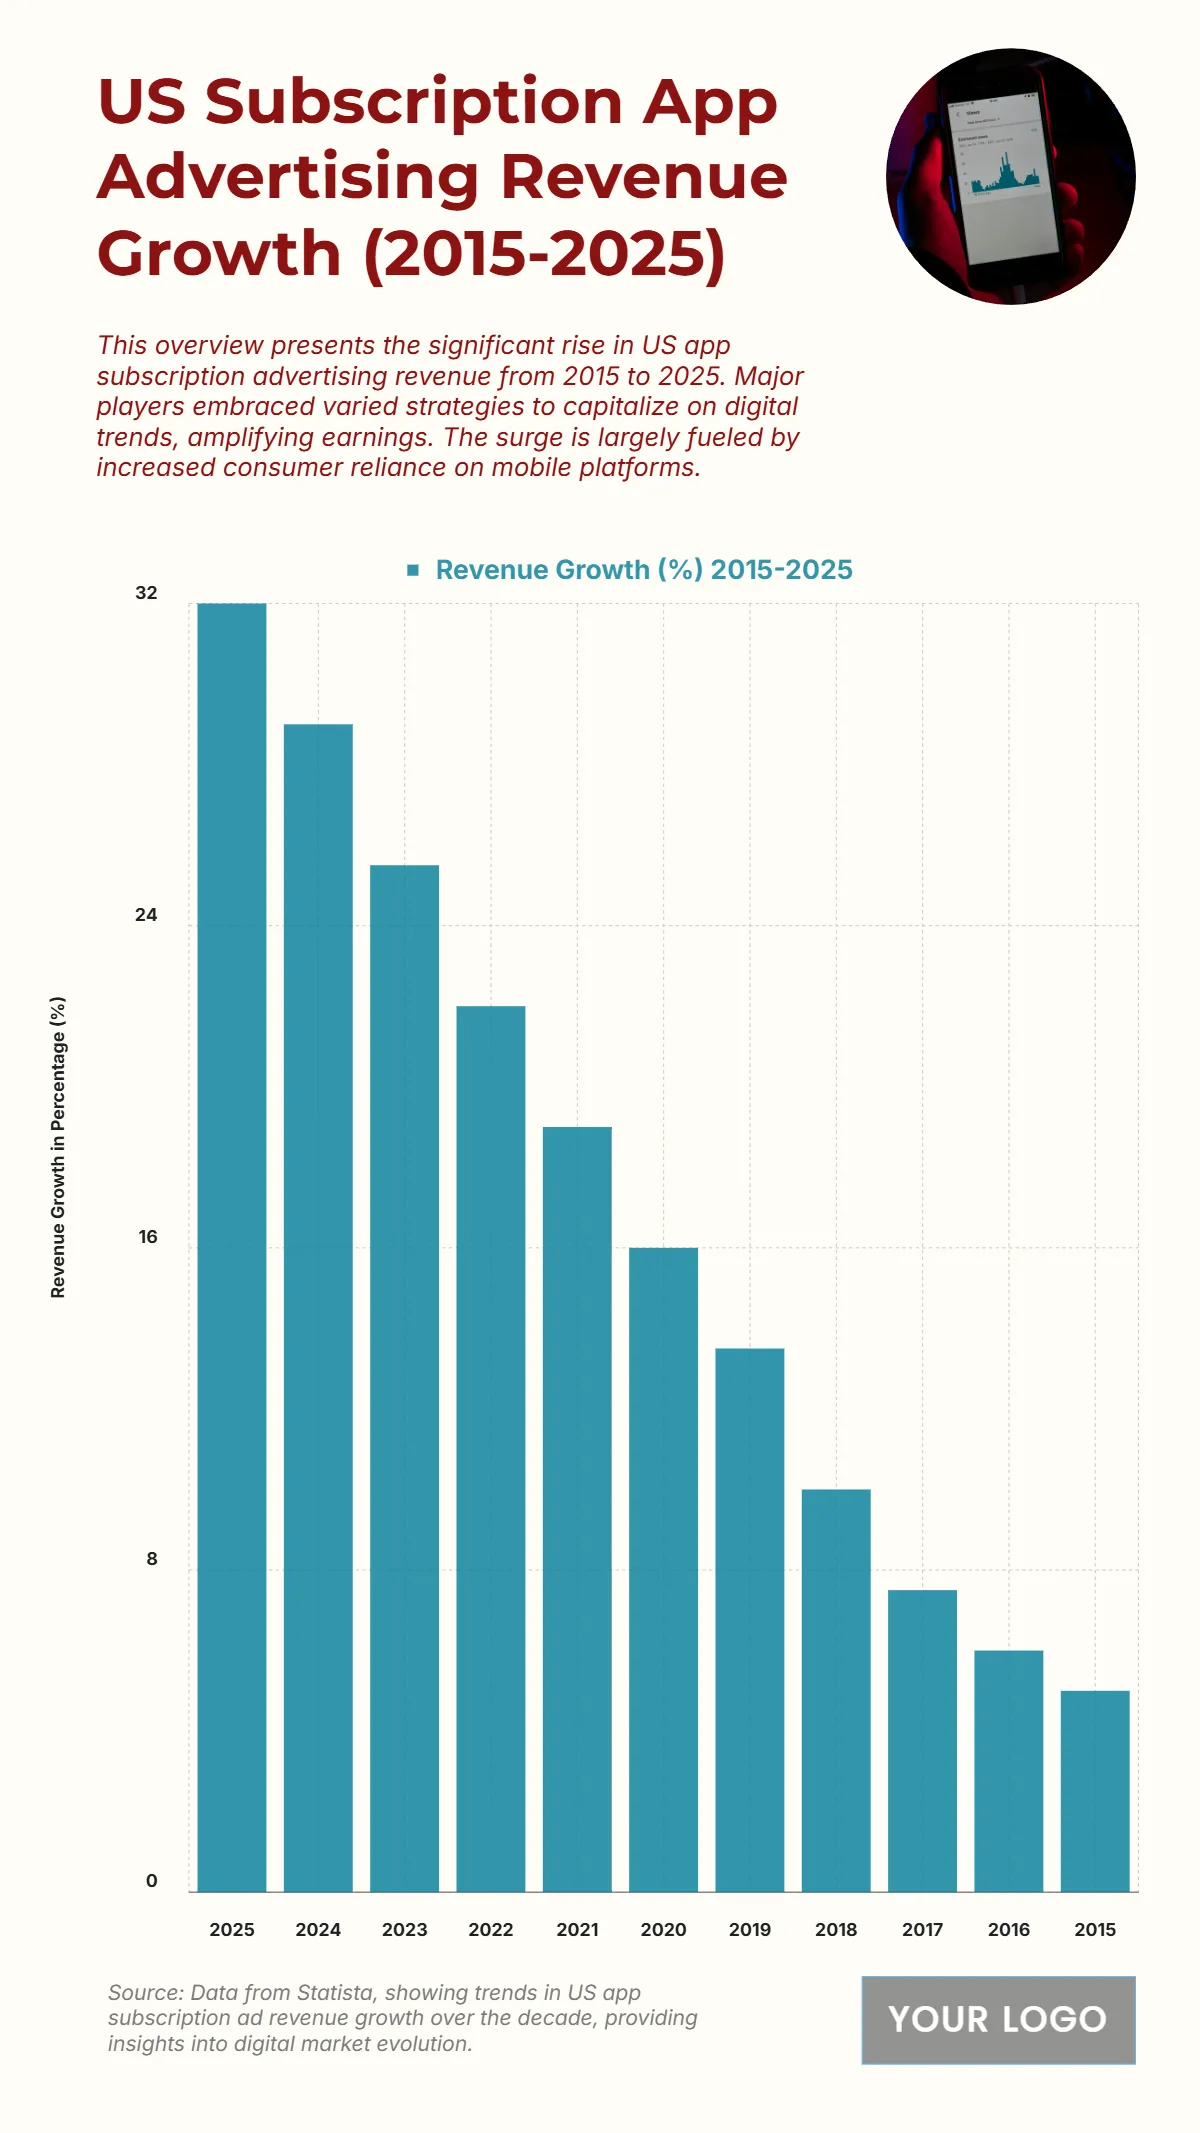
Free US Subscription App Advertising Revenue Growth from 2015 to 2025 Chart
The chart shows the growth of US subscription app advertising revenue from 2015 to 2025, revealing a strong upward trend fueled by the increasing popularity of mobile platforms and digital services. Revenue growth begins at 5% in 2015, gradually rising to 6% in 2016 and 7.5% in 2017, as subscription models start gaining traction. The momentum strengthens through 10% in 2018, 13.5% in 2019, and 16% in 2020, signaling expanding market adoption. By 2021, growth reaches 19%, followed by 22% in 2022 and 25.5% in 2023, reflecting rising consumer dependence on digital entertainment and productivity apps. The trend peaks at 29% in 2024 and 32% in 2025, representing the sector’s continued profitability and evolving ad monetization strategies. Overall, the data underscores the transformative impact of subscription-based ecosystems, driven by mobile convenience and sustained advertiser investment in digital engagement.
| Labels | Revenue Growth (%) 2015–2025 |
|---|---|
| 2025 | 32 |
| 2024 | 29 |
| 2023 | 25.5 |
| 2022 | 22 |
| 2021 | 19 |
| 2020 | 16 |
| 2019 | 13.5 |
| 2018 | 10 |
| 2017 | 7.5 |
| 2016 | 6 |
| 2015 | 5 |


