Free US Creative Ad Format Performance by Industry from 2015 to 2025 Chart
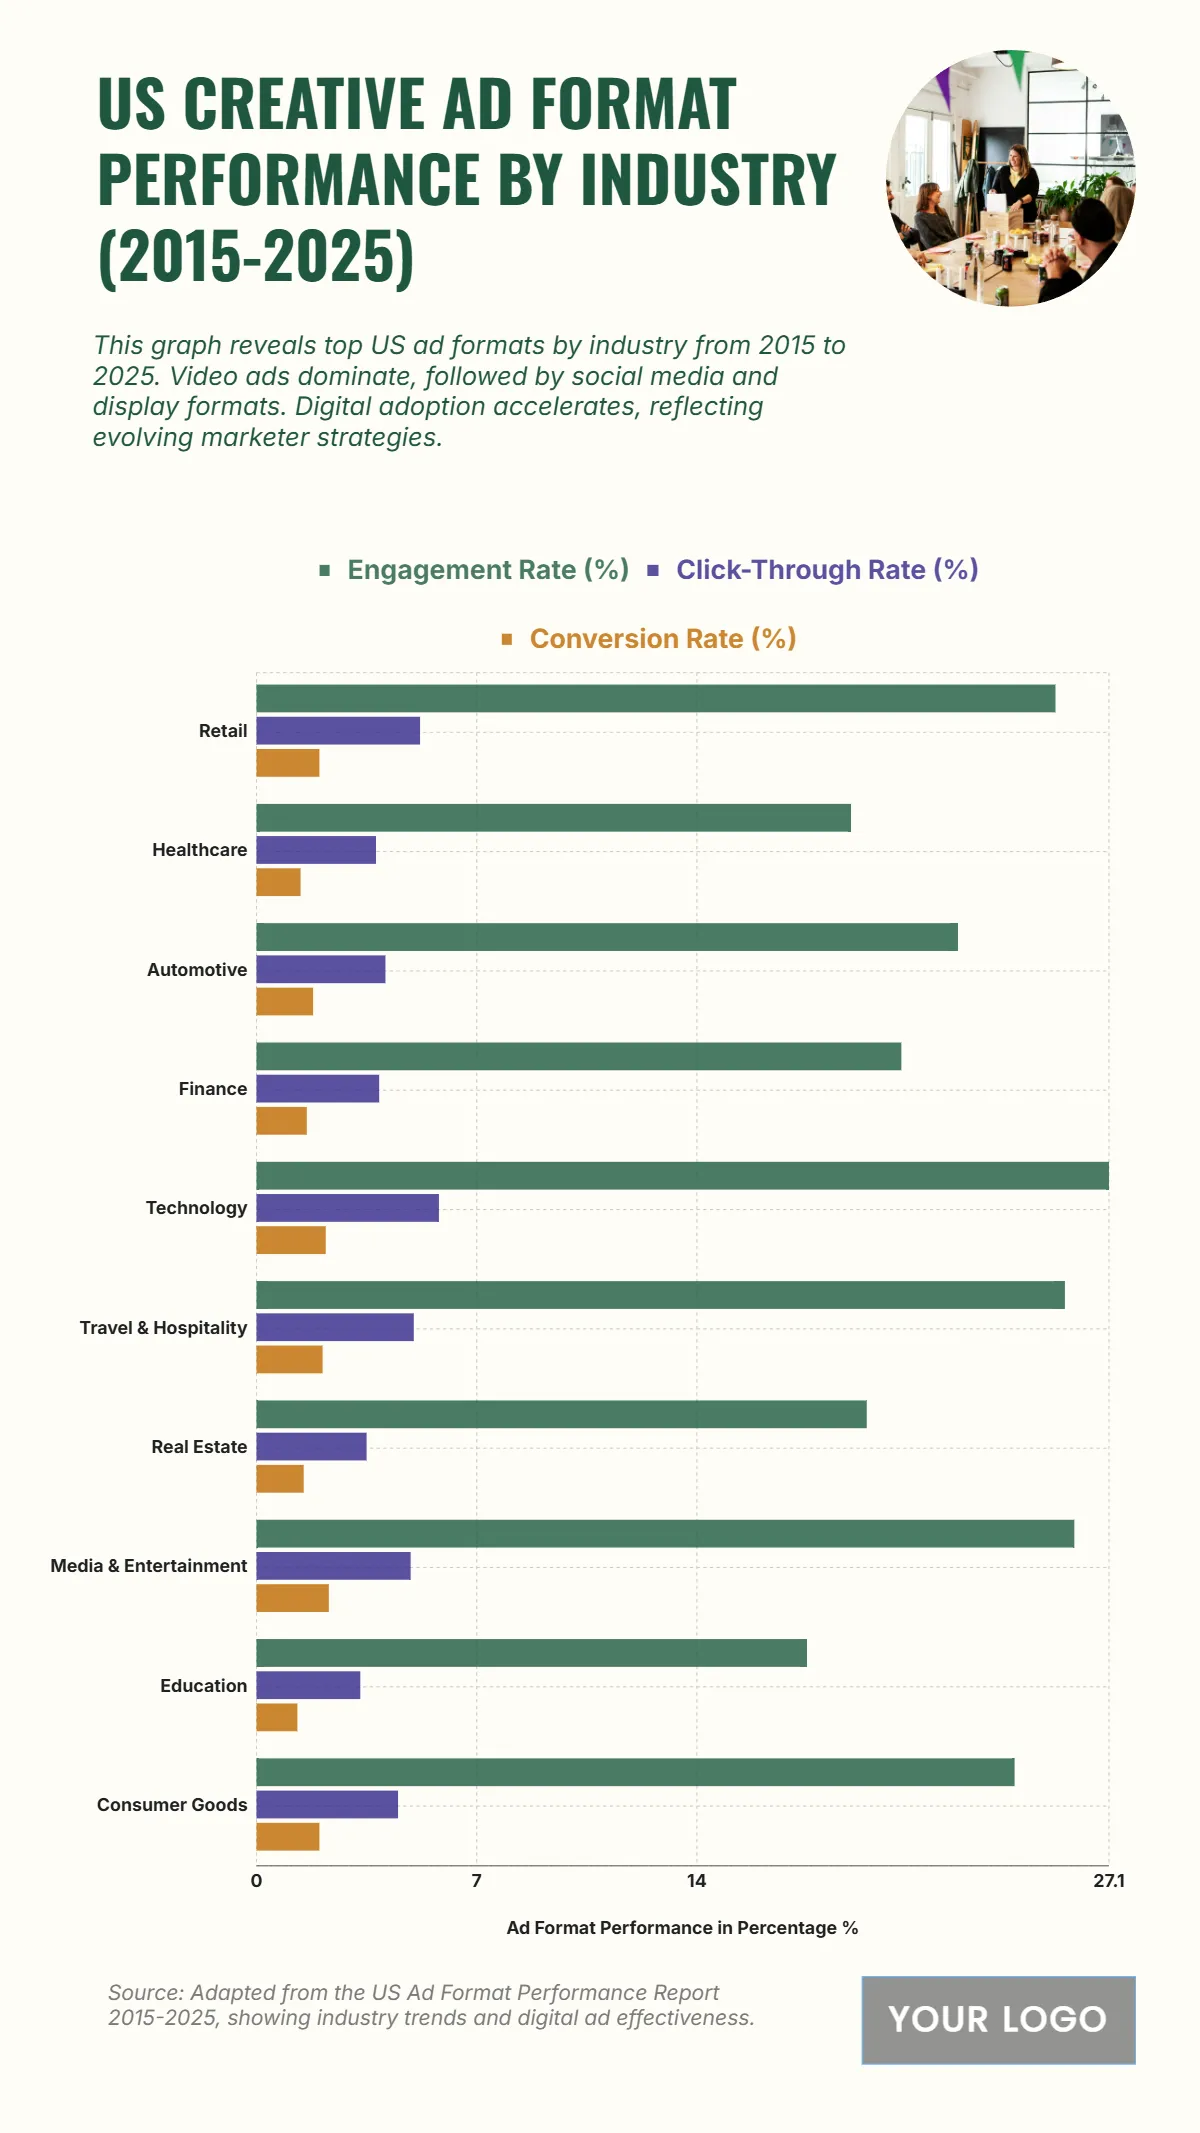
The chart illustrates the performance of US creative ad formats by industry from 2015 to 2025, showcasing key metrics across engagement, click-through, and conversion rates. Technology leads with a 27.1% engagement rate, the highest among all sectors, along with a 5.8% click-through rate and 2.2% conversion rate, reflecting strong audience interaction with tech-related campaigns. Media & Entertainment follows closely, achieving 26% engagement and 2.3% conversion, underscoring the influence of visual and streaming ads. Travel & Hospitality records 25.7% engagement and 5% click-through, indicating high consumer responsiveness. Retail and Consumer Goods maintain competitive performance, each achieving engagement rates above 24%, supported by consistent conversions of 2%. Meanwhile, Healthcare (18.9%) and Education (17.5%) show moderate engagement, focusing on informational campaigns. Overall, the data highlights technology and entertainment as top-performing sectors, while steady gains in retail and travel demonstrate expanding opportunities for consumer-driven ad strategies.
| Labels | Engagement Rate (%) | Click-Through Rate (%) | Conversion Rate (%) |
|---|---|---|---|
| Retail | 25.4 | 5.2 | 2.0 |
| Healthcare | 18.9 | 3.8 | 1.4 |
| Automotive | 22.3 | 4.1 | 1.8 |
| Finance | 20.5 | 3.9 | 1.6 |
| Technology | 27.1 | 5.8 | 2.2 |
| Travel & Hospitality | 25.7 | 5.0 | 2.1 |
| Real Estate | 19.4 | 3.5 | 1.5 |
| Media & Entertainment | 26.0 | 4.9 | 2.3 |
| Education | 17.5 | 3.3 | 1.3 |
| Consumer Goods | 24.1 | 4.5 | 2.0 |


