Free US Local Advertising Revenue by Region from 2020 to 2025 Chart
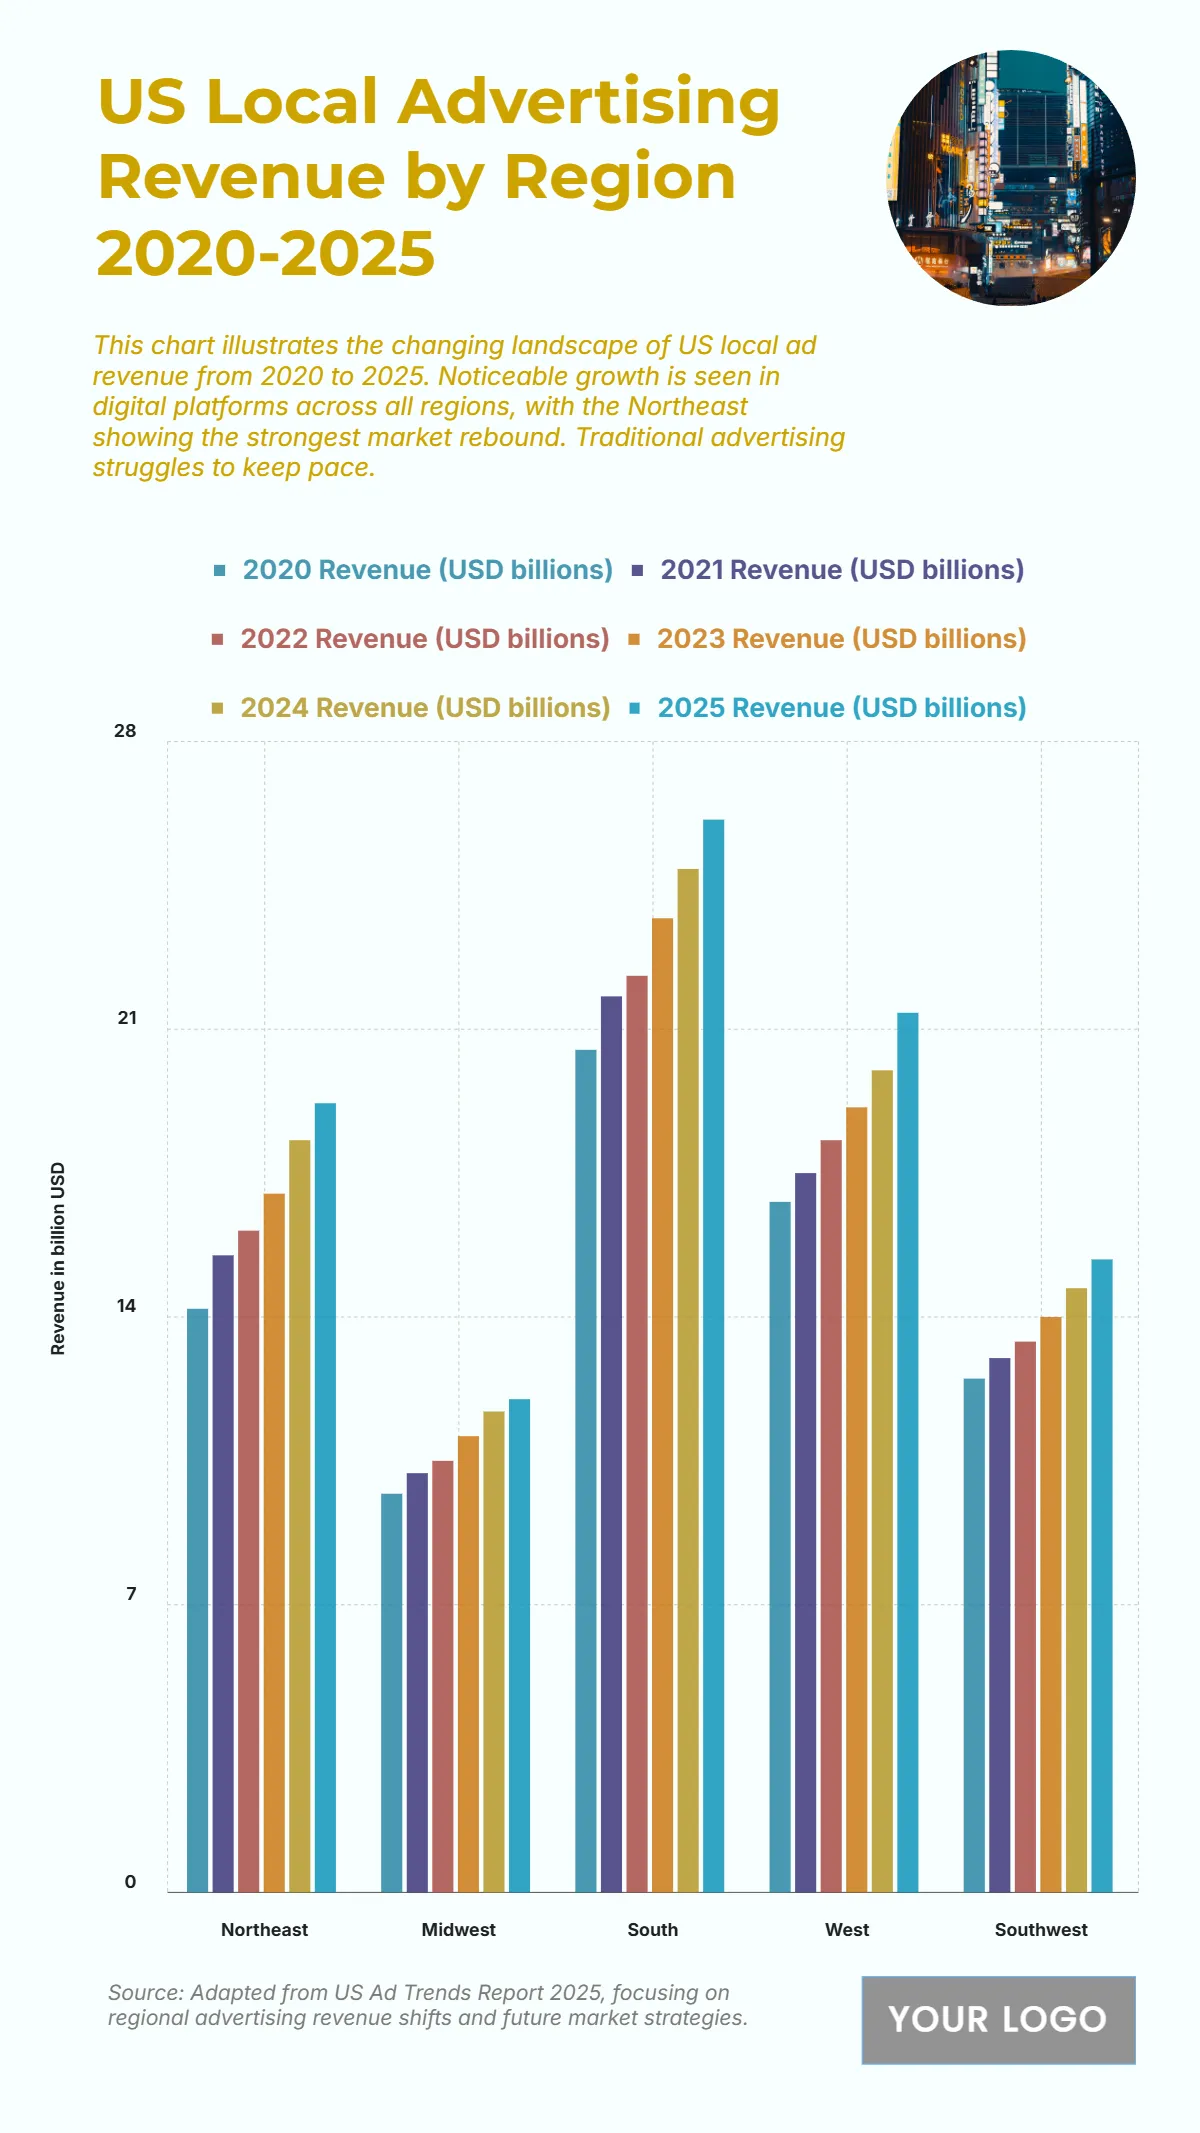
The chart illustrates the steady rise in US local advertising revenue across all regions from 2020 to 2025, with the South leading consistently in every year. The South increased from 20.5 billion USD in 2020 to 26.1 billion USD in 2025, showing the strongest overall growth. The Northeast followed, climbing from 14.2 billion USD in 2020 to 19.2 billion USD in 2025, reflecting a robust rebound in the region. The West region also recorded notable gains, rising from 16.8 billion USD to 21.4 billion USD, while the Midwest grew more steadily, from 9.7 billion USD to 12 billion USD over the same period. Meanwhile, the Southwest moved upward from 12.5 billion USD to 15.4 billion USD, maintaining moderate but consistent progress. This upward trend across regions highlights the strong recovery and digital advertising expansion, with the Northeast and South as the top-performing markets by 2025.
| Labels | 2020 Revenue (USD billions) | 2021 Revenue (USD billions) | 2022 Revenue (USD billions) | 2023 Revenue (USD billions) | 2024 Revenue (USD billions) | 2025 Revenue (USD billions) |
|---|---|---|---|---|---|---|
| Northeast | 14.2 | 15.5 | 16.1 | 17 | 18.3 | 19.2 |
| Midwest | 9.7 | 10.2 | 10.5 | 11.1 | 11.7 | 12 |
| South | 20.5 | 21.8 | 22.3 | 23.7 | 24.9 | 26.1 |
| West | 16.8 | 17.5 | 18.3 | 19.1 | 20 | 21.4 |
| Southwest | 12.5 | 13 | 13.4 | 14 | 14.7 | 15.4 |


