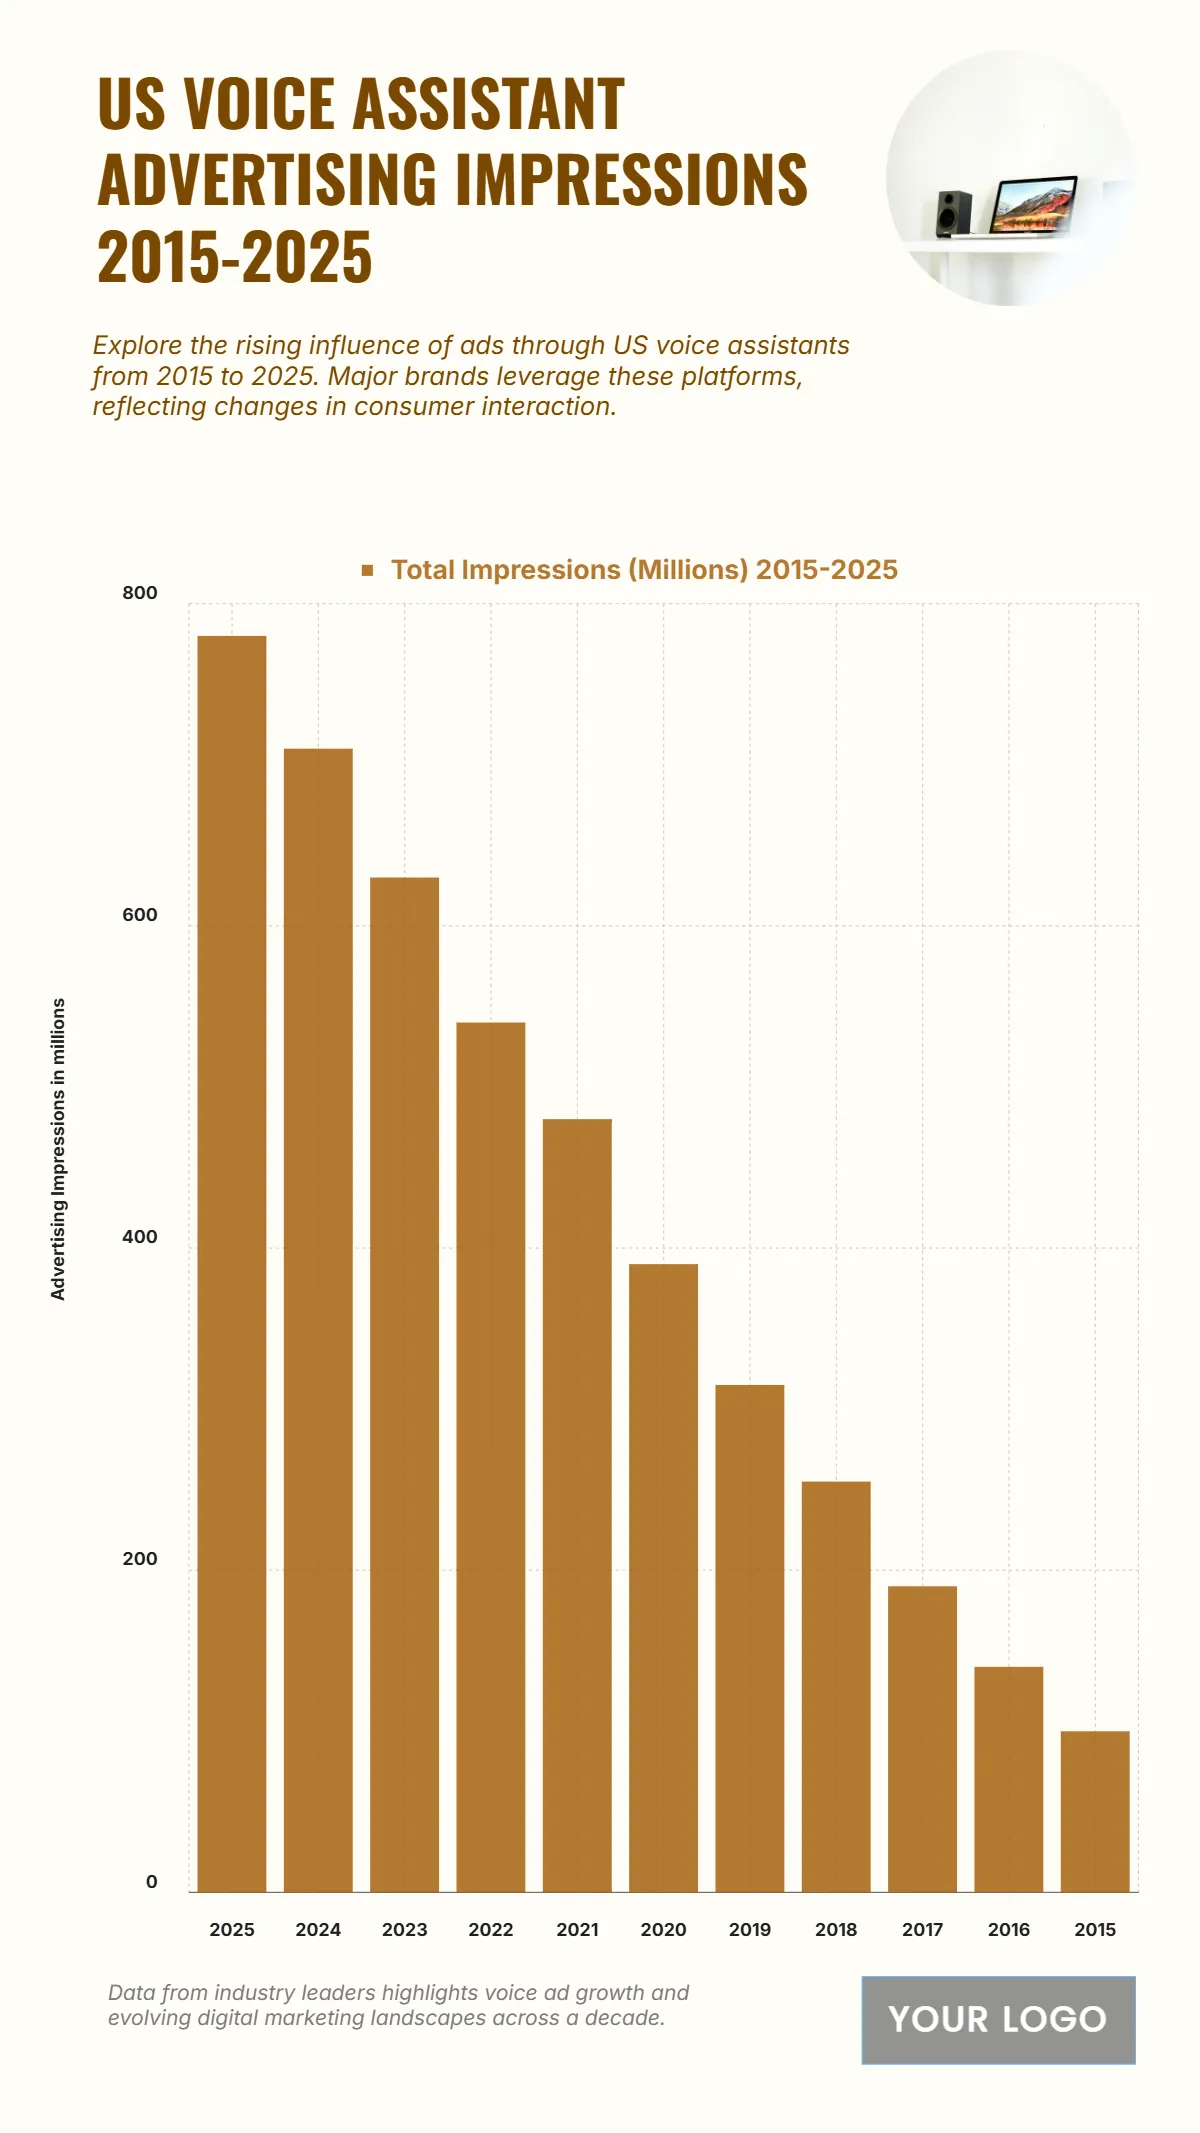
Free US Voice Assistant Advertising Impressions from 2015 to 2025 Chart
The chart shows a steady and sharp increase in advertising impressions through US voice assistants from 2015 to 2025, reflecting the growing adoption of voice-enabled platforms by major brands. Starting at 100 million impressions in 2015, the numbers rose consistently each year, reaching 140 million in 2016, 190 million in 2017, and 255 million in 2018. This upward trend accelerated after 2019 with 315 million, followed by 390 million in 2020, and a notable 480 million in 2021, signaling stronger integration into marketing strategies. The growth remained robust, climbing to 540 million in 2022, 630 million in 2023, and 710 million in 2024, before peaking at 780 million impressions in 2025. This reflects a nearly eightfold increase over a decade, emphasizing the dominance of voice as a key digital advertising channel in consumer interaction and brand engagement.
| Labels | Total Impressions (Millions) 2015–2025 |
|---|---|
| 2025 | 780 |
| 2024 | 710 |
| 2023 | 630 |
| 2022 | 540 |
| 2021 | 480 |
| 2020 | 390 |
| 2019 | 315 |
| 2018 | 255 |
| 2017 | 190 |
| 2016 | 140 |
| 2015 | 100 |


