Free US Geo-Targeted Advertising Spend from 2015 to 2025 Chart
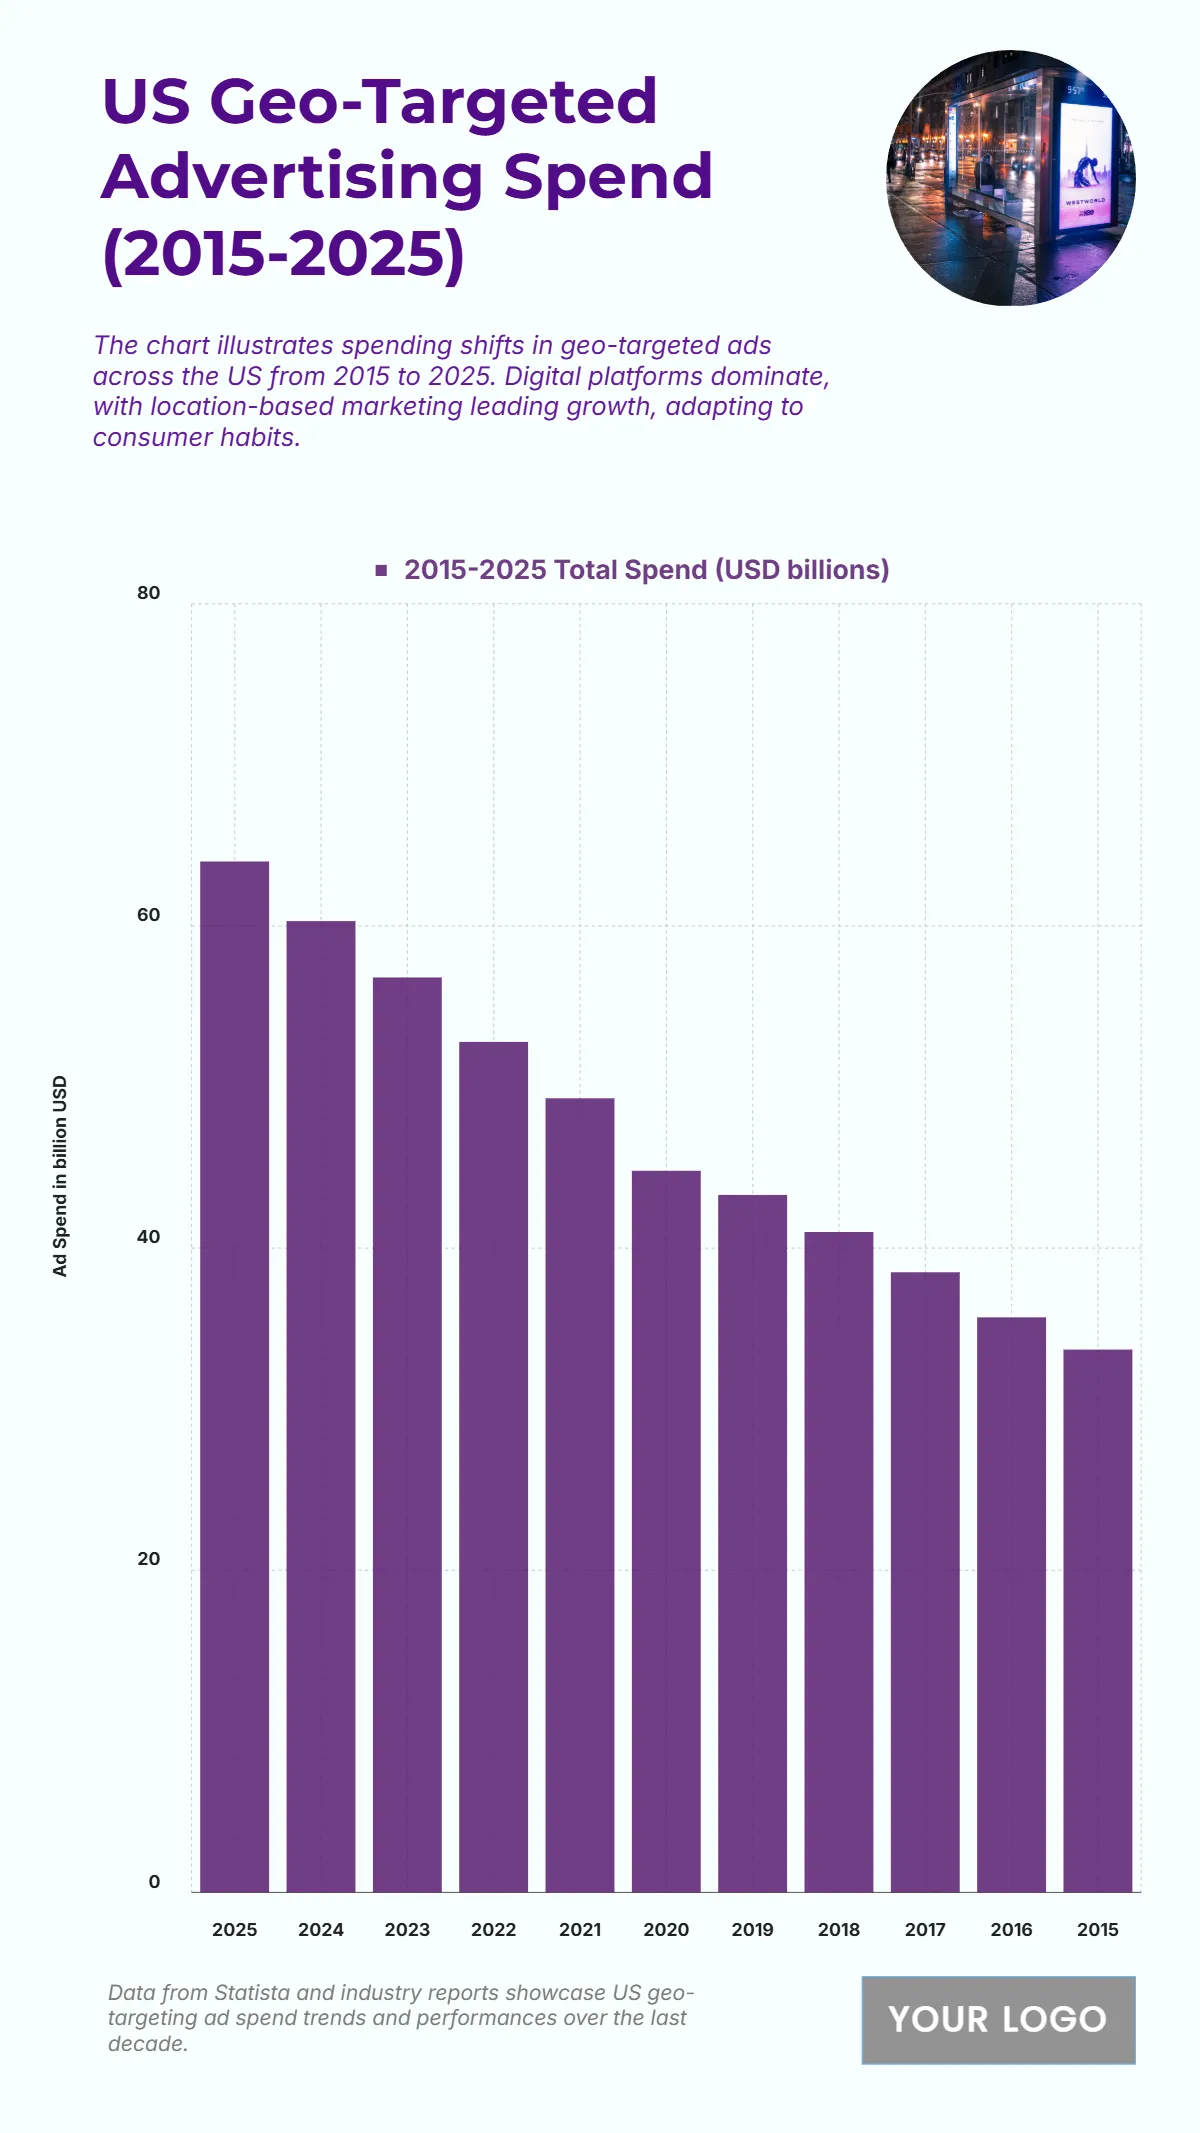
The chart shows a strong upward trajectory in geo-targeted advertising spend in the US from 2015 to 2025, reflecting the increasing reliance on location-based marketing strategies. Spending started at 33.7 billion USD in 2015 and steadily climbed to 35.7 billion USD in 2016 and 38.5 billion USD in 2017, indicating early adoption growth. By 2018, it rose to 41 billion USD, and further to 43.3 billion USD in 2019 and 44.8 billion USD in 2020, showing consistent momentum. In 2021, spending reached 49.3 billion USD, surpassing the mid-range mark, and grew to 52.8 billion USD in 2022, 56.8 billion USD in 2023, and 60.3 billion USD in 2024. By 2025, spending peaked at 64 billion USD, marking almost a 90% increase over the decade. This trend underscores the strategic importance of geo-targeted campaigns in driving personalized and efficient ad engagements nationwide.
| Labels | 2015–2025 Total Spend (USD billions) |
|---|---|
| 2025 | 64 |
| 2024 | 60.3 |
| 2023 | 56.8 |
| 2022 | 52.8 |
| 2021 | 49.3 |
| 2020 | 44.8 |
| 2019 | 43.3 |
| 2018 | 41 |
| 2017 | 38.5 |
| 2016 | 35.7 |
| 2015 | 33.7 |


