Free US Retail Programmatic Ad Spend by Category from 2020 to 2025 Chart
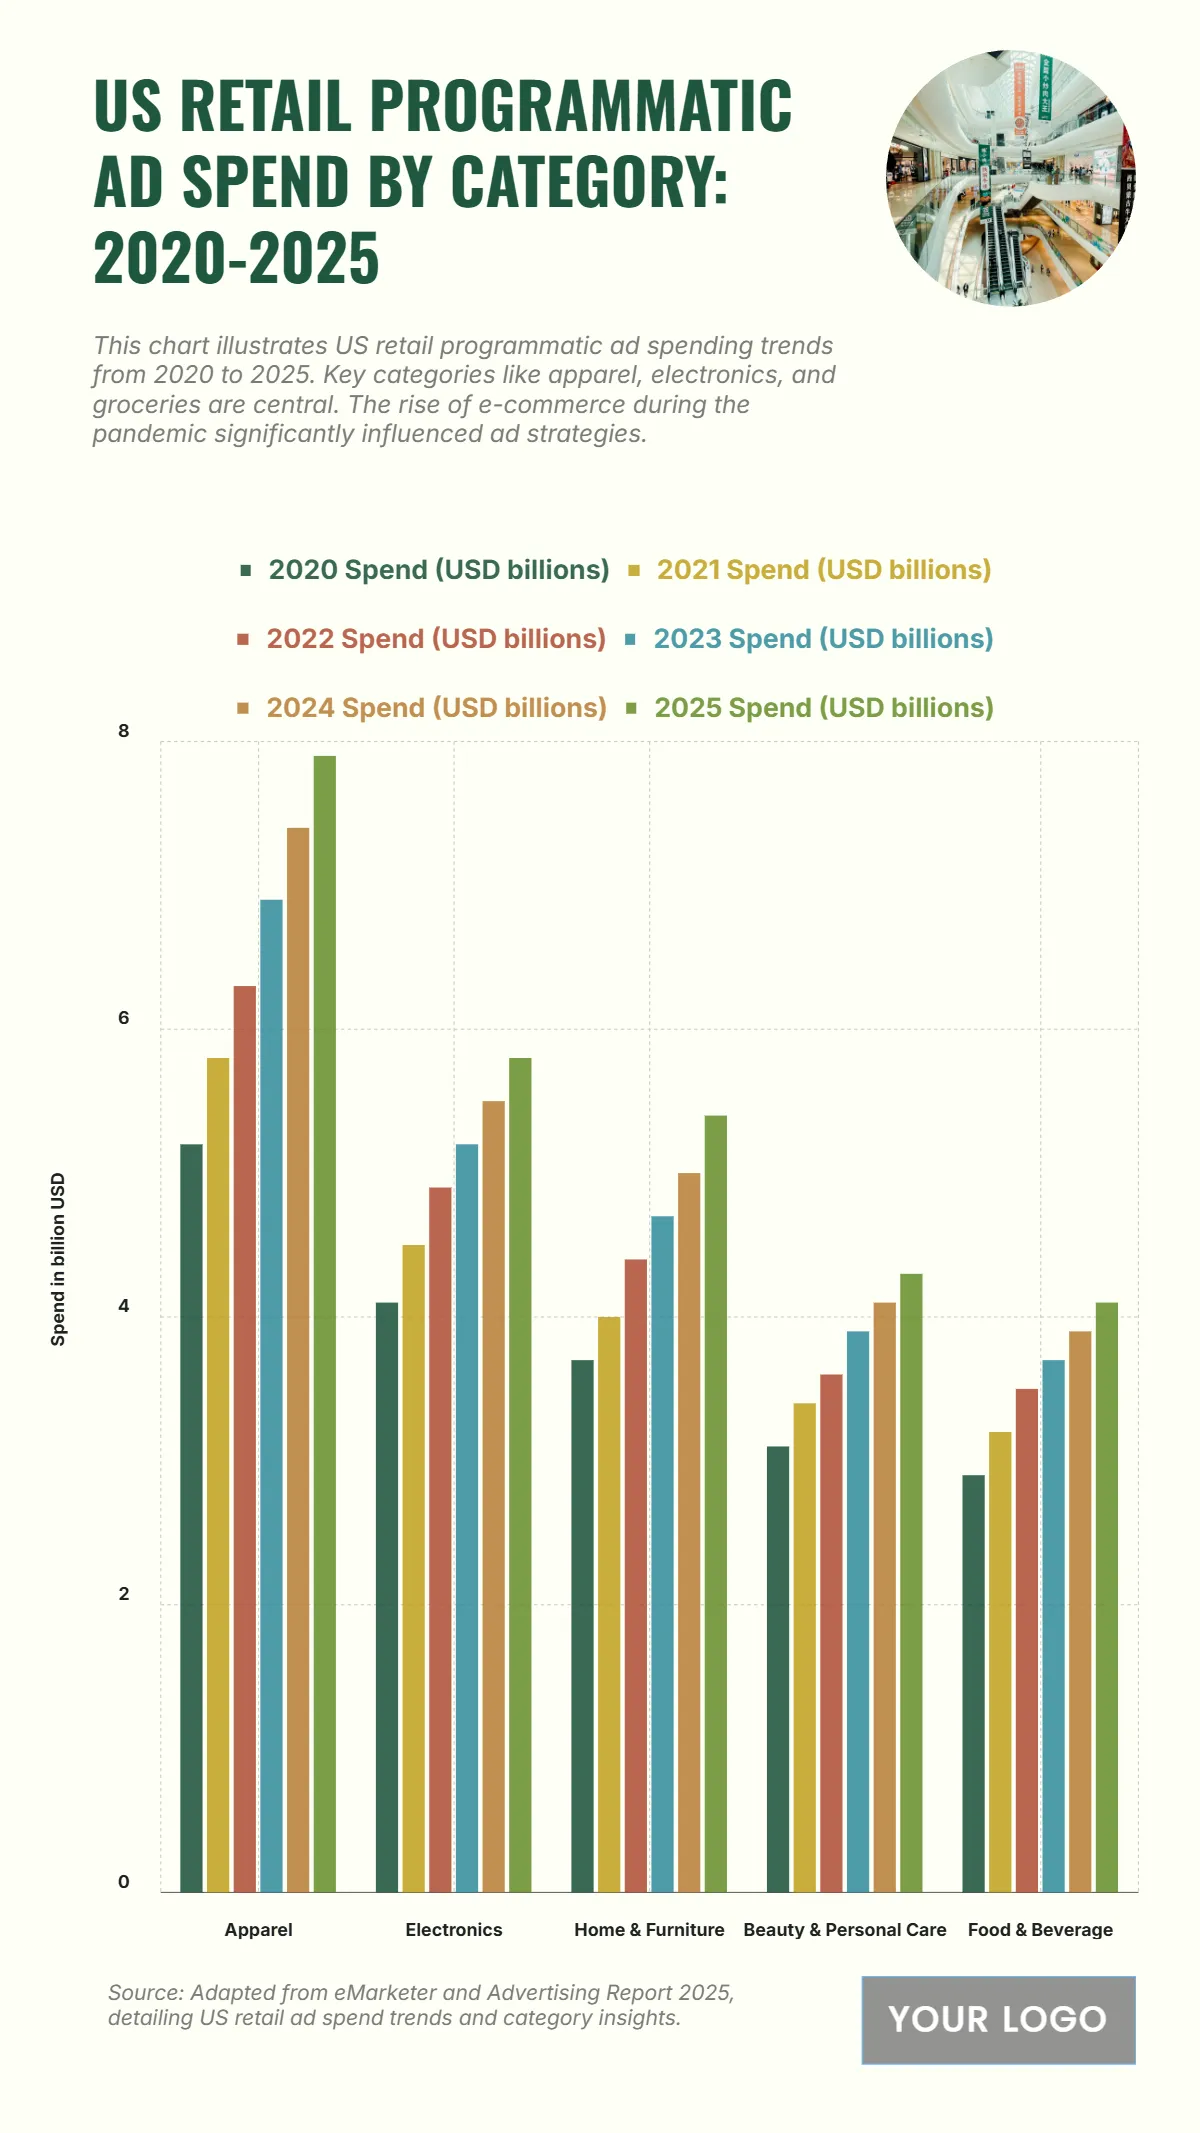
The chart shows the steady increase in US retail programmatic ad spending across all categories from 2020 to 2025, led consistently by the Apparel sector. Apparel spending rose from 5.2 billion USD in 2020 to 7.9 billion USD in 2025, showing the strongest growth driven by the surge in e-commerce. Electronics followed with an increase from 4.1 billion USD in 2020 to 5.8 billion USD in 2025, highlighting strong consumer engagement in tech products. Home & Furniture spending grew from 3.7 billion USD to 5.4 billion USD, indicating sustained digital retail investment. Beauty & Personal Care rose from 3.1 billion USD to 4.3 billion USD, while Food & Beverage increased from 2.9 billion USD to 4.1 billion USD, reflecting growing reliance on digital advertising even in traditionally offline categories. This overall upward trend underscores the pivotal role of targeted programmatic ads in shaping retail marketing strategies.
| Labels | 2020 Spend (USD billions) | 2021 Spend (USD billions) | 2022 Spend (USD billions) | 2023 Spend (USD billions) | 2024 Spend (USD billions) | 2025 Spend (USD billions) |
|---|---|---|---|---|---|---|
| Apparel | 5.2 | 5.8 | 6.3 | 6.9 | 7.4 | 7.9 |
| Electronics | 4.1 | 4.5 | 4.9 | 5.2 | 5.5 | 5.8 |
| Home & Furniture | 3.7 | 4.0 | 4.4 | 4.7 | 5.0 | 5.4 |
| Beauty & Personal Care | 3.1 | 3.4 | 3.6 | 3.9 | 4.1 | 4.3 |
| Food & Beverage | 2.9 | 3.2 | 3.5 | 3.7 | 3.9 | 4.1 |


