Free US Podcast Ad Revenue Share by Industry from 2015 to 2025 Chart
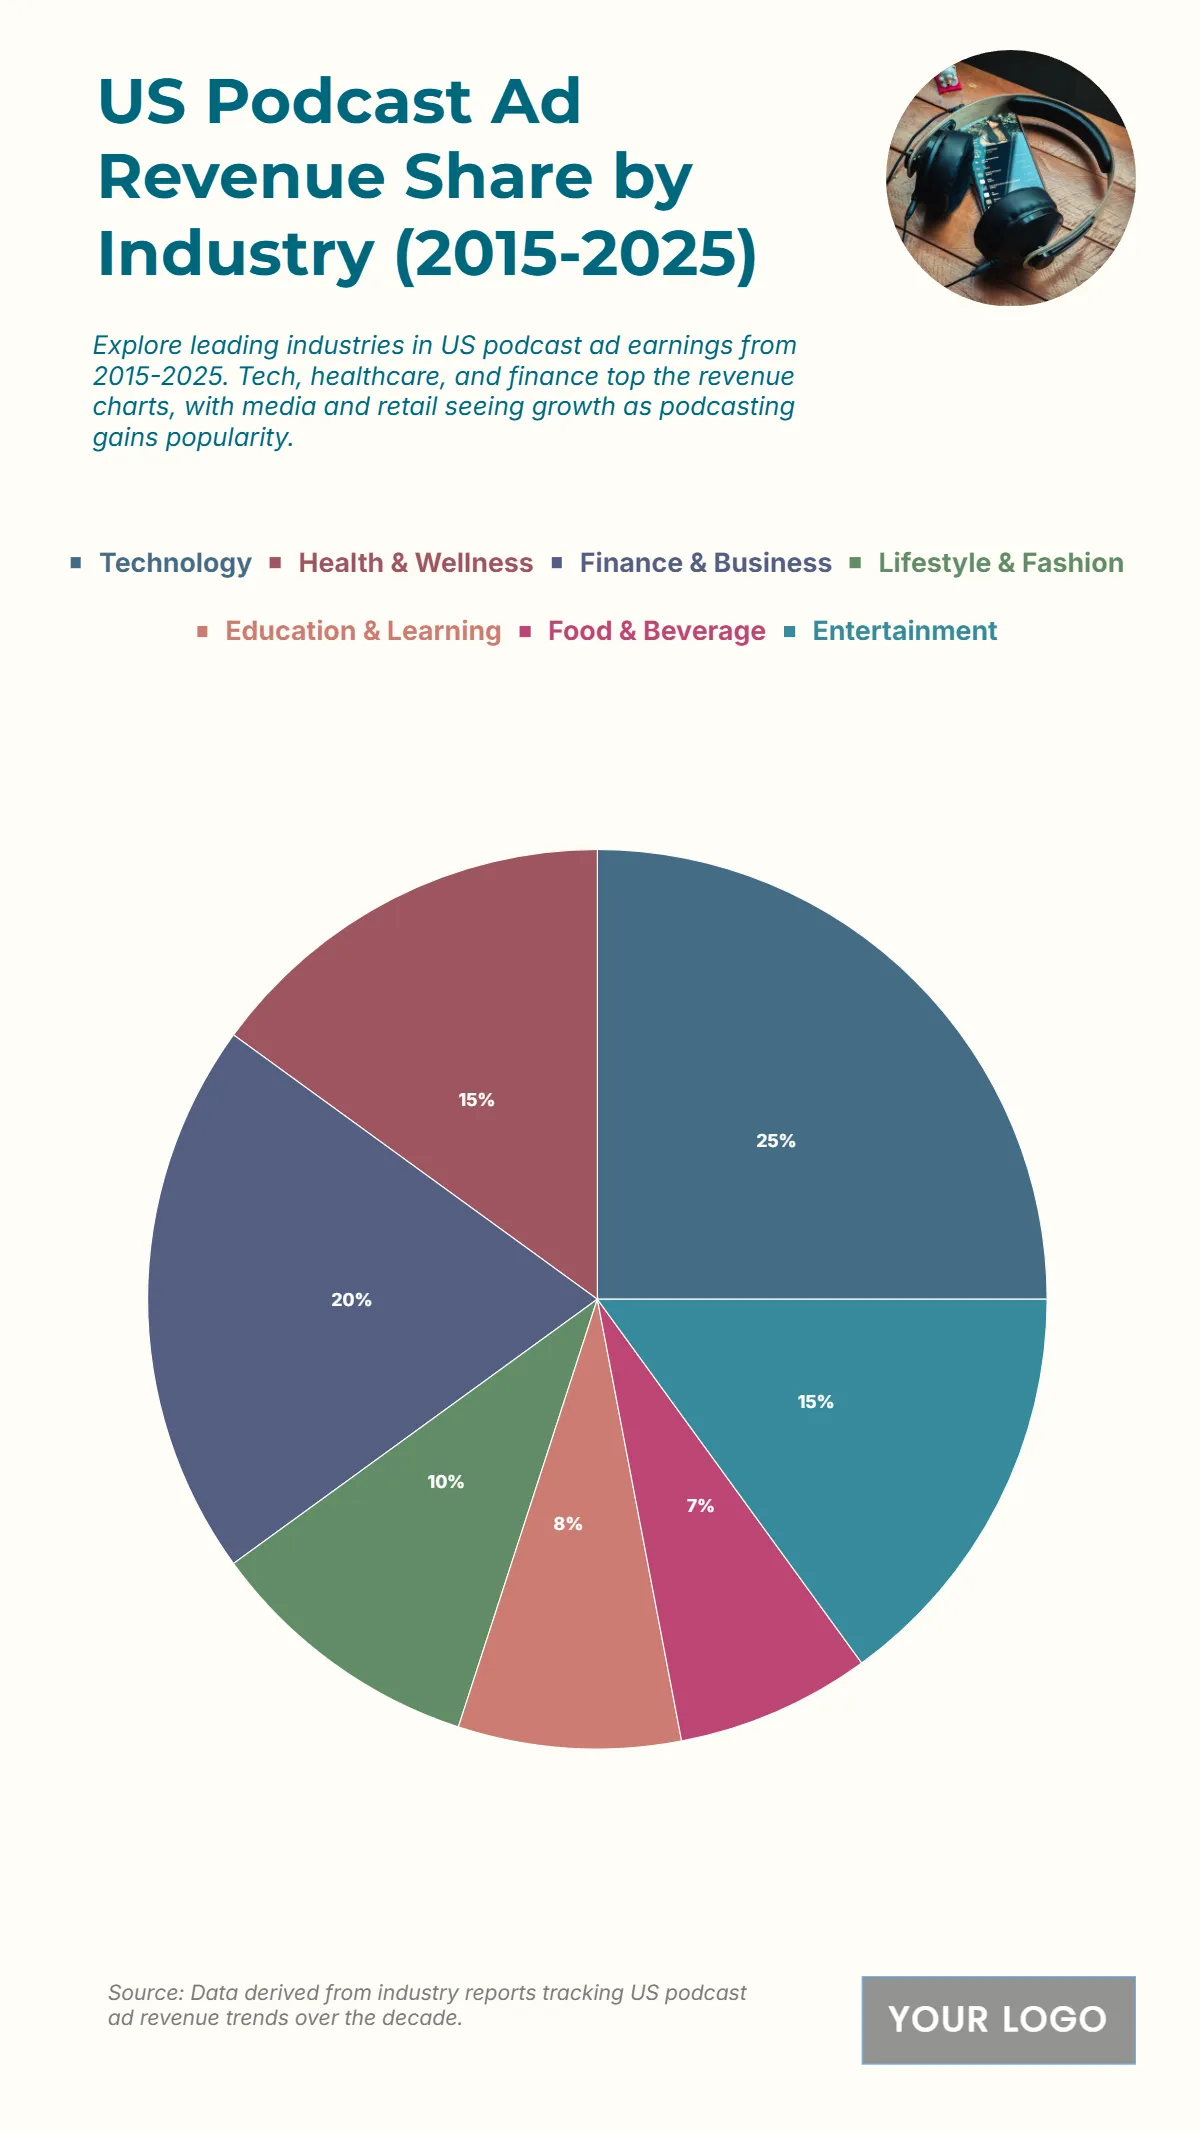
The chart reveals the distribution of podcast ad revenue share across major industries in the US from 2015 to 2025, showing a strong dominance of Technology at 25%, making it the leading sector. Finance & Business follows at 20%, indicating high investment in financial education and services through podcasting platforms. Health & Wellness and Entertainment each account for 15%, underscoring growing consumer interest in well-being and media content. Lifestyle & Fashion captures 10%, reflecting consistent engagement through influencer and trend-based content. Meanwhile, Education & Learning holds 8% and Food & Beverage 7%, showing moderate but steady contributions to podcast advertising. These figures highlight how technology, finance, and health lead the podcast ad landscape, aligning with broader digital marketing growth trends.
| Labels | 2015–2025 Revenue Share (%) |
|---|---|
| Technology | 25 |
| Health & Wellness | 15 |
| Finance & Business | 20 |
| Lifestyle & Fashion | 10 |
| Education & Learning | 8 |
| Food & Beverage | 7 |
| Entertainment | 15 |


