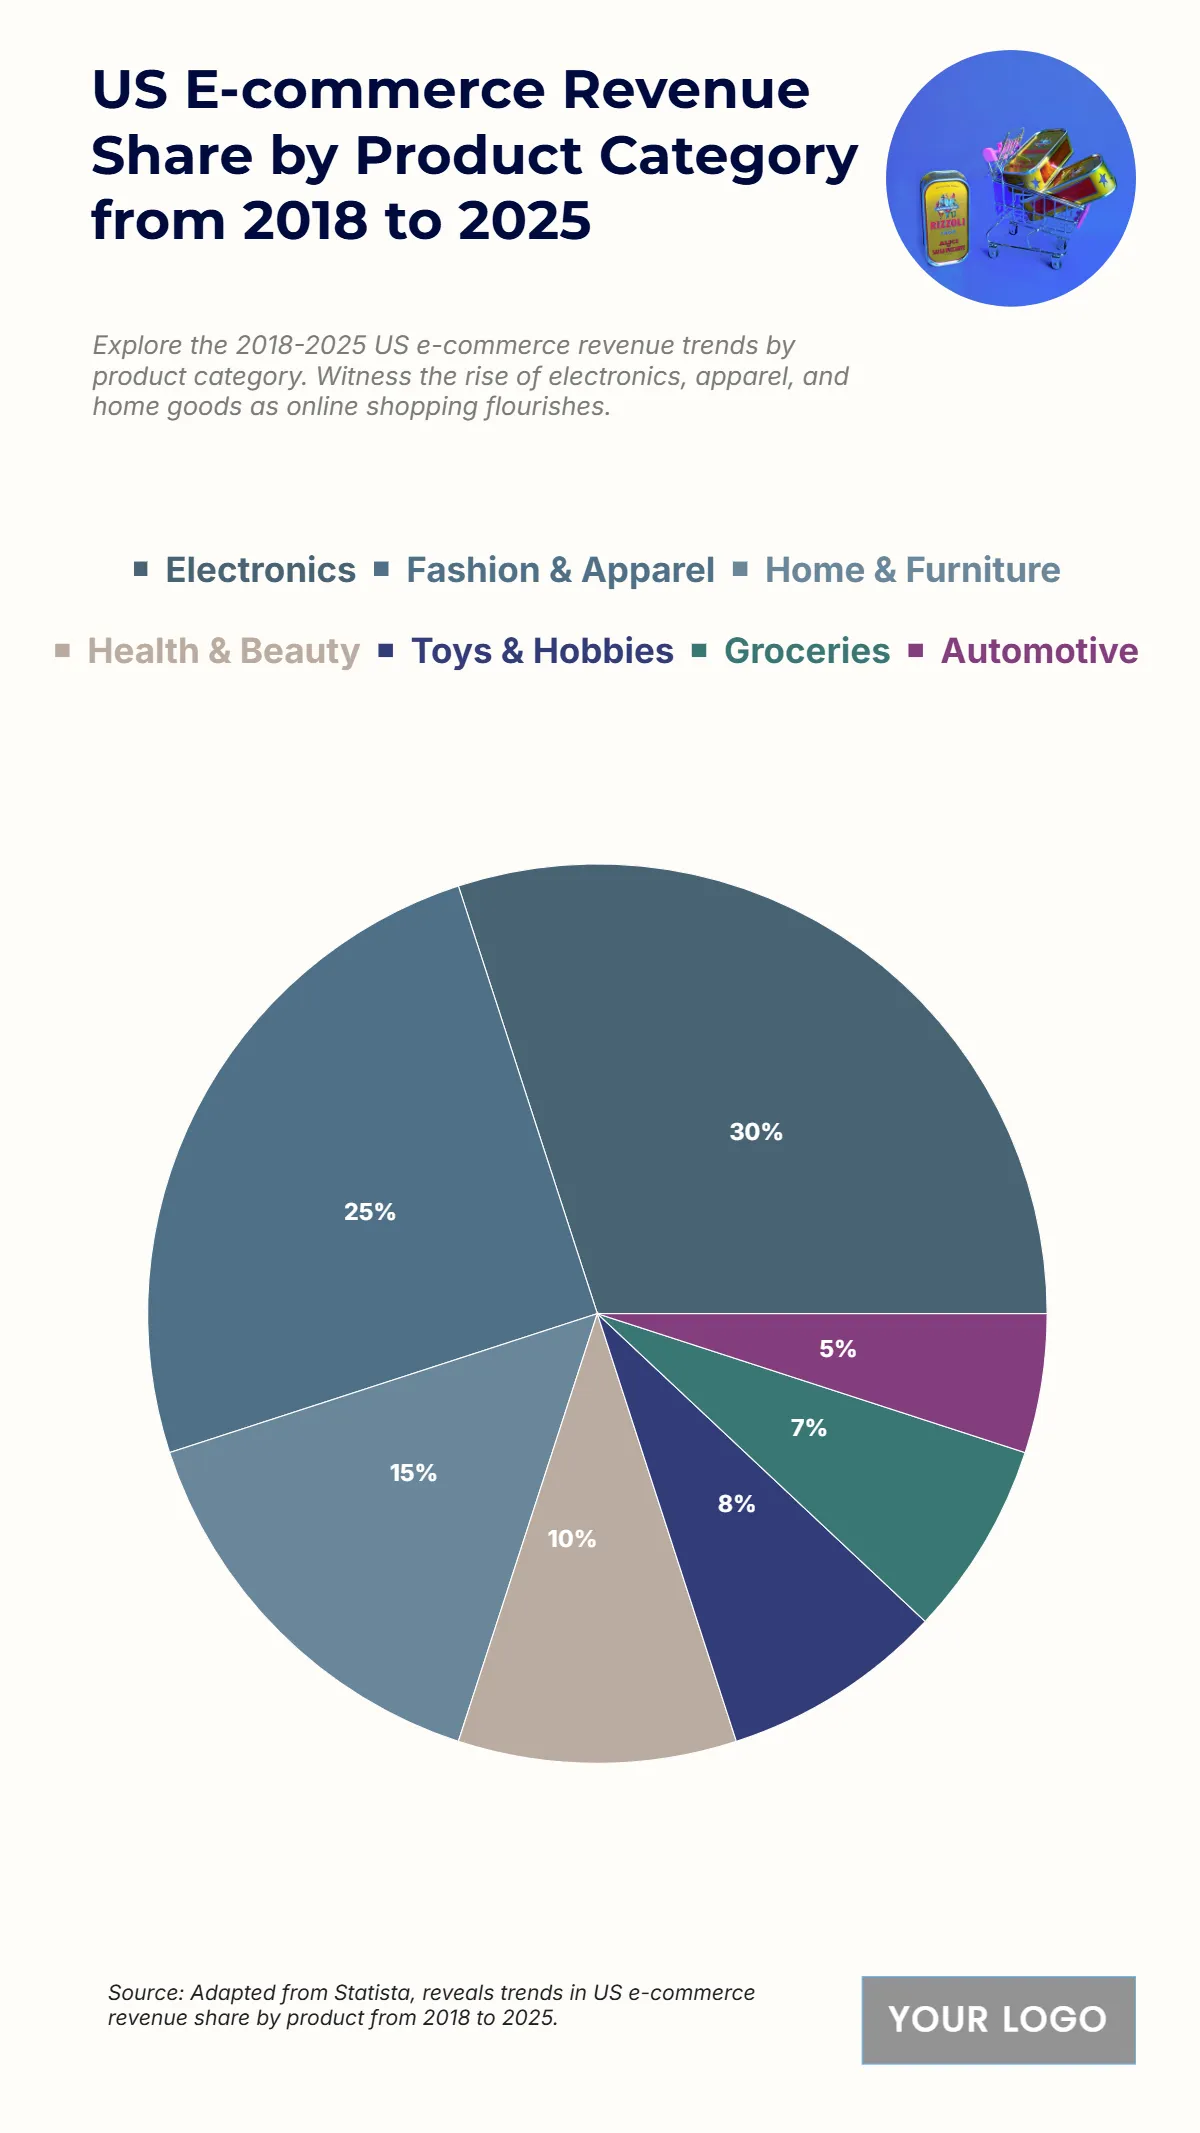
Free US E-commerce Revenue Share by Product Category from 2018 to 2025 Chart
The chart demonstrates the U.S. e-commerce revenue distribution by product category from 2018 to 2025, showcasing which sectors dominate online sales. Electronics leads the market with a 30% average revenue share, reflecting consumers’ growing demand for gadgets, smart devices, and tech products. Following closely, Fashion & Apparel accounts for 25%, driven by digital retail innovations and social media influence. Home & Furniture contributes 15%, highlighting the steady demand for home improvement and décor products. Meanwhile, Health & Beauty secures 10%, boosted by online wellness and skincare trends. Toys & Hobbies hold 8%, reflecting increased online purchases in leisure products, while Groceries capture 7%, signaling the expansion of online grocery platforms. Finally, Automotive comprises 5%, the smallest segment but with potential for growth due to digital transformation in car accessories and parts. Overall, the chart underscores a strong digital retail ecosystem led by electronics and fashion, reshaping consumer purchasing behavior.
| Labels | 2018–2025 Average Revenue Share (%) |
|---|---|
| Electronics | 30 |
| Fashion & Apparel | 25 |
| Home & Furniture | 15 |
| Health & Beauty | 10 |
| Toys & Hobbies | 8 |
| Groceries | 7 |
| Automotive | 5 |


