Free US Consumer Spending Trends from 2015 to 2025 Chart
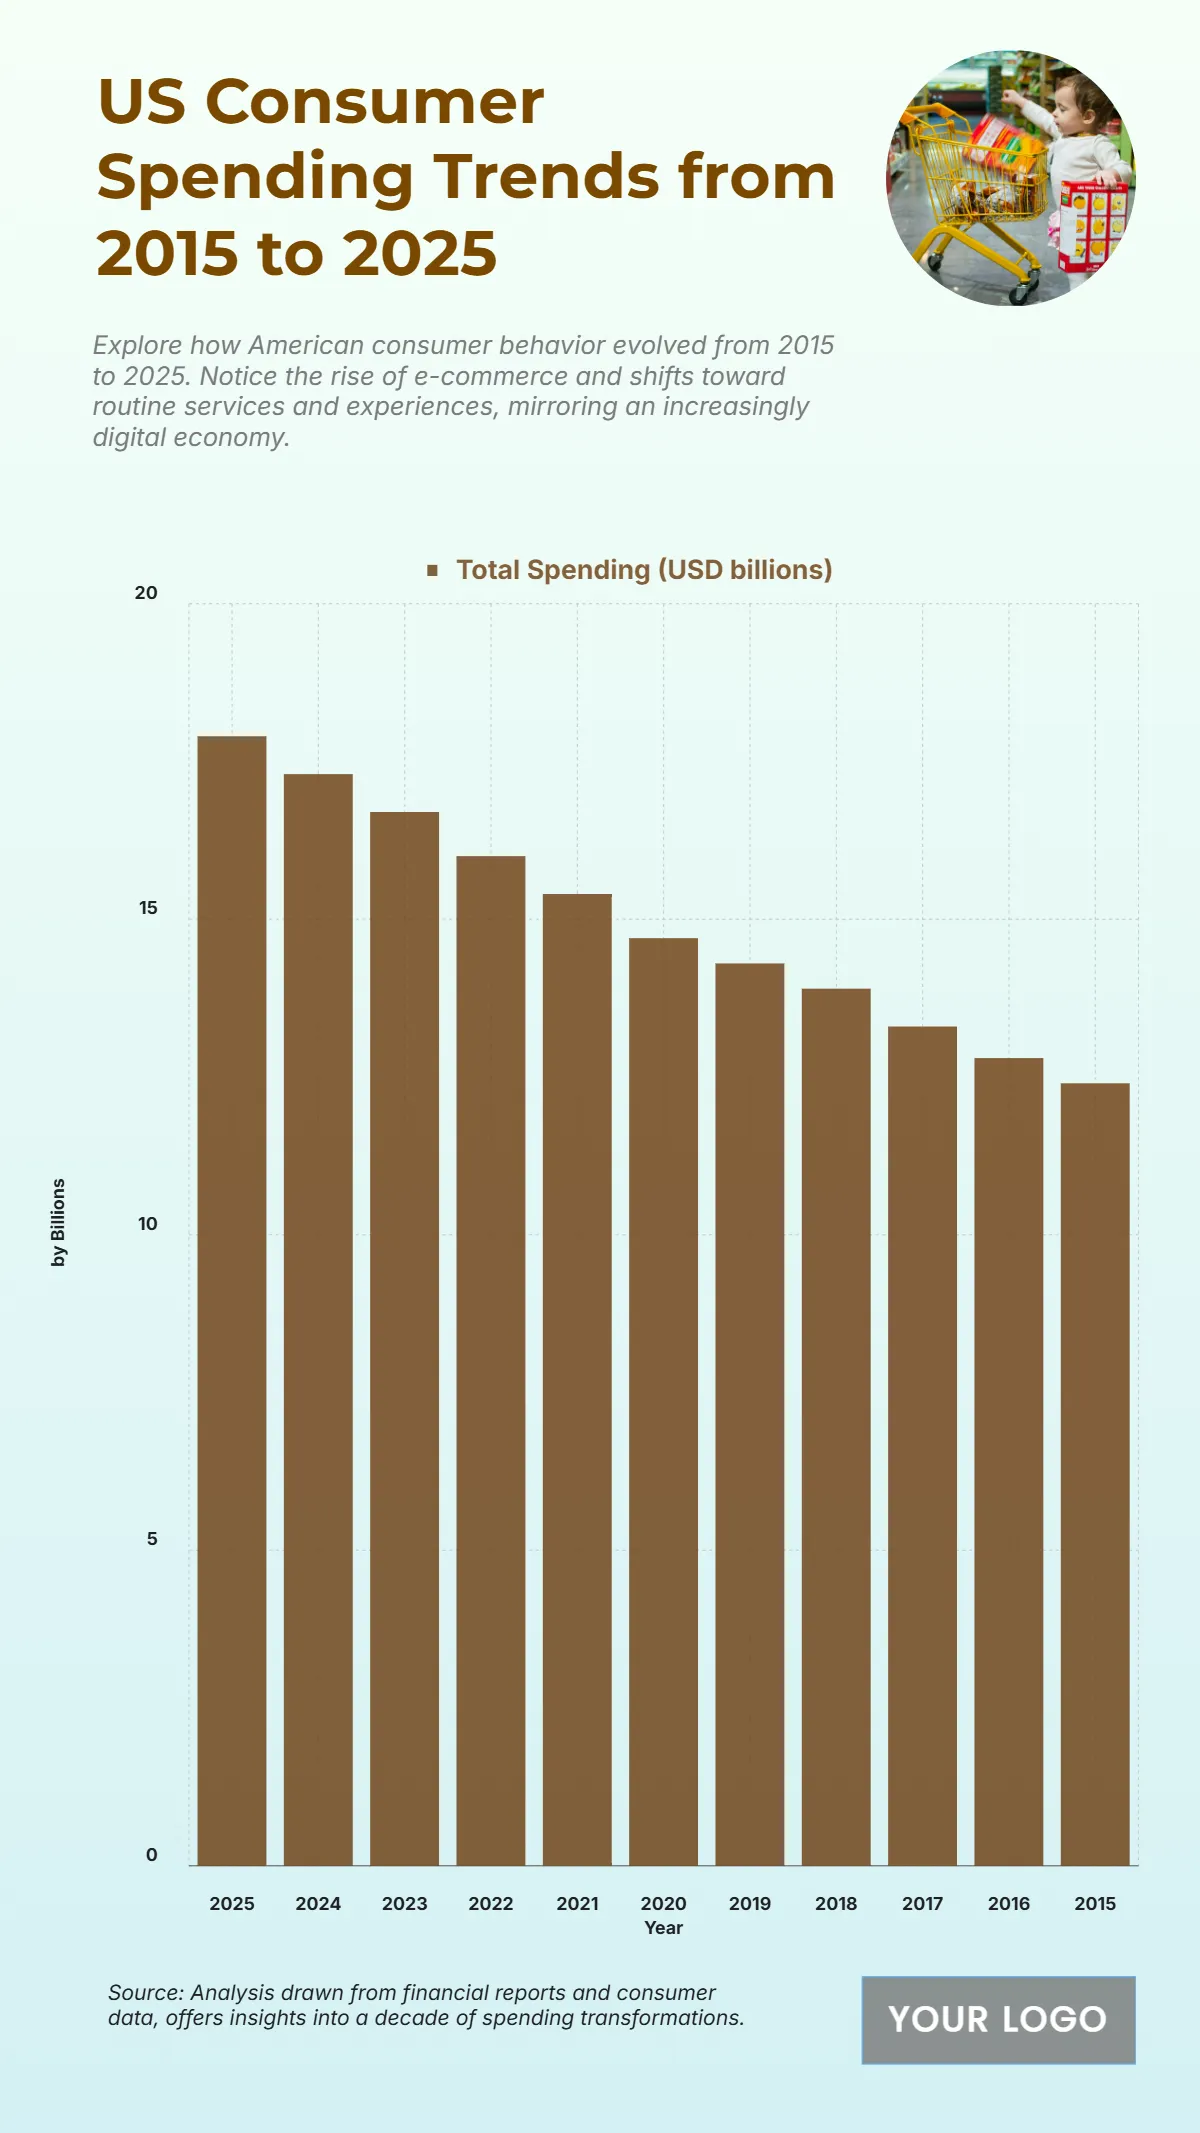
The chart presents a decade-long view of U.S. consumer spending from 2015 to 2025, highlighting gradual increases that reflect economic resilience and digital transformation. Total spending began at $12.4 billion in 2015 and steadily rose to $17.9 billion by 2025, indicating a 44% growth over the period. The rise from $12.8 billion in 2016 to $15.4 billion in 2021 demonstrates a consistent upward trajectory, with spending driven by factors such as e-commerce growth, online services, and renewed consumer confidence. The trend accelerates notably between 2020 and 2025, where the increase from $14.7 billion to $17.9 billion signals a shift toward digital-driven purchasing habits and lifestyle spending. Despite inflationary pressures and economic fluctuations, overall consumer expenditure continues to climb, underscoring how technological integration and online platforms have reshaped spending behavior in the U.S., making digital commerce and services central to the nation’s evolving financial landscape.
| Labels | Total Spending (USD billions) |
|---|---|
| 2025 | 17.9 |
| 2024 | 17.3 |
| 2023 | 16.7 |
| 2022 | 16.0 |
| 2021 | 15.4 |
| 2020 | 14.7 |
| 2019 | 14.3 |
| 2018 | 13.9 |
| 2017 | 13.3 |
| 2016 | 12.8 |
| 2015 | 12.4 |


