Free Top 10 US Industries by Online Conversion Rate from 2018 to 2025 Chart
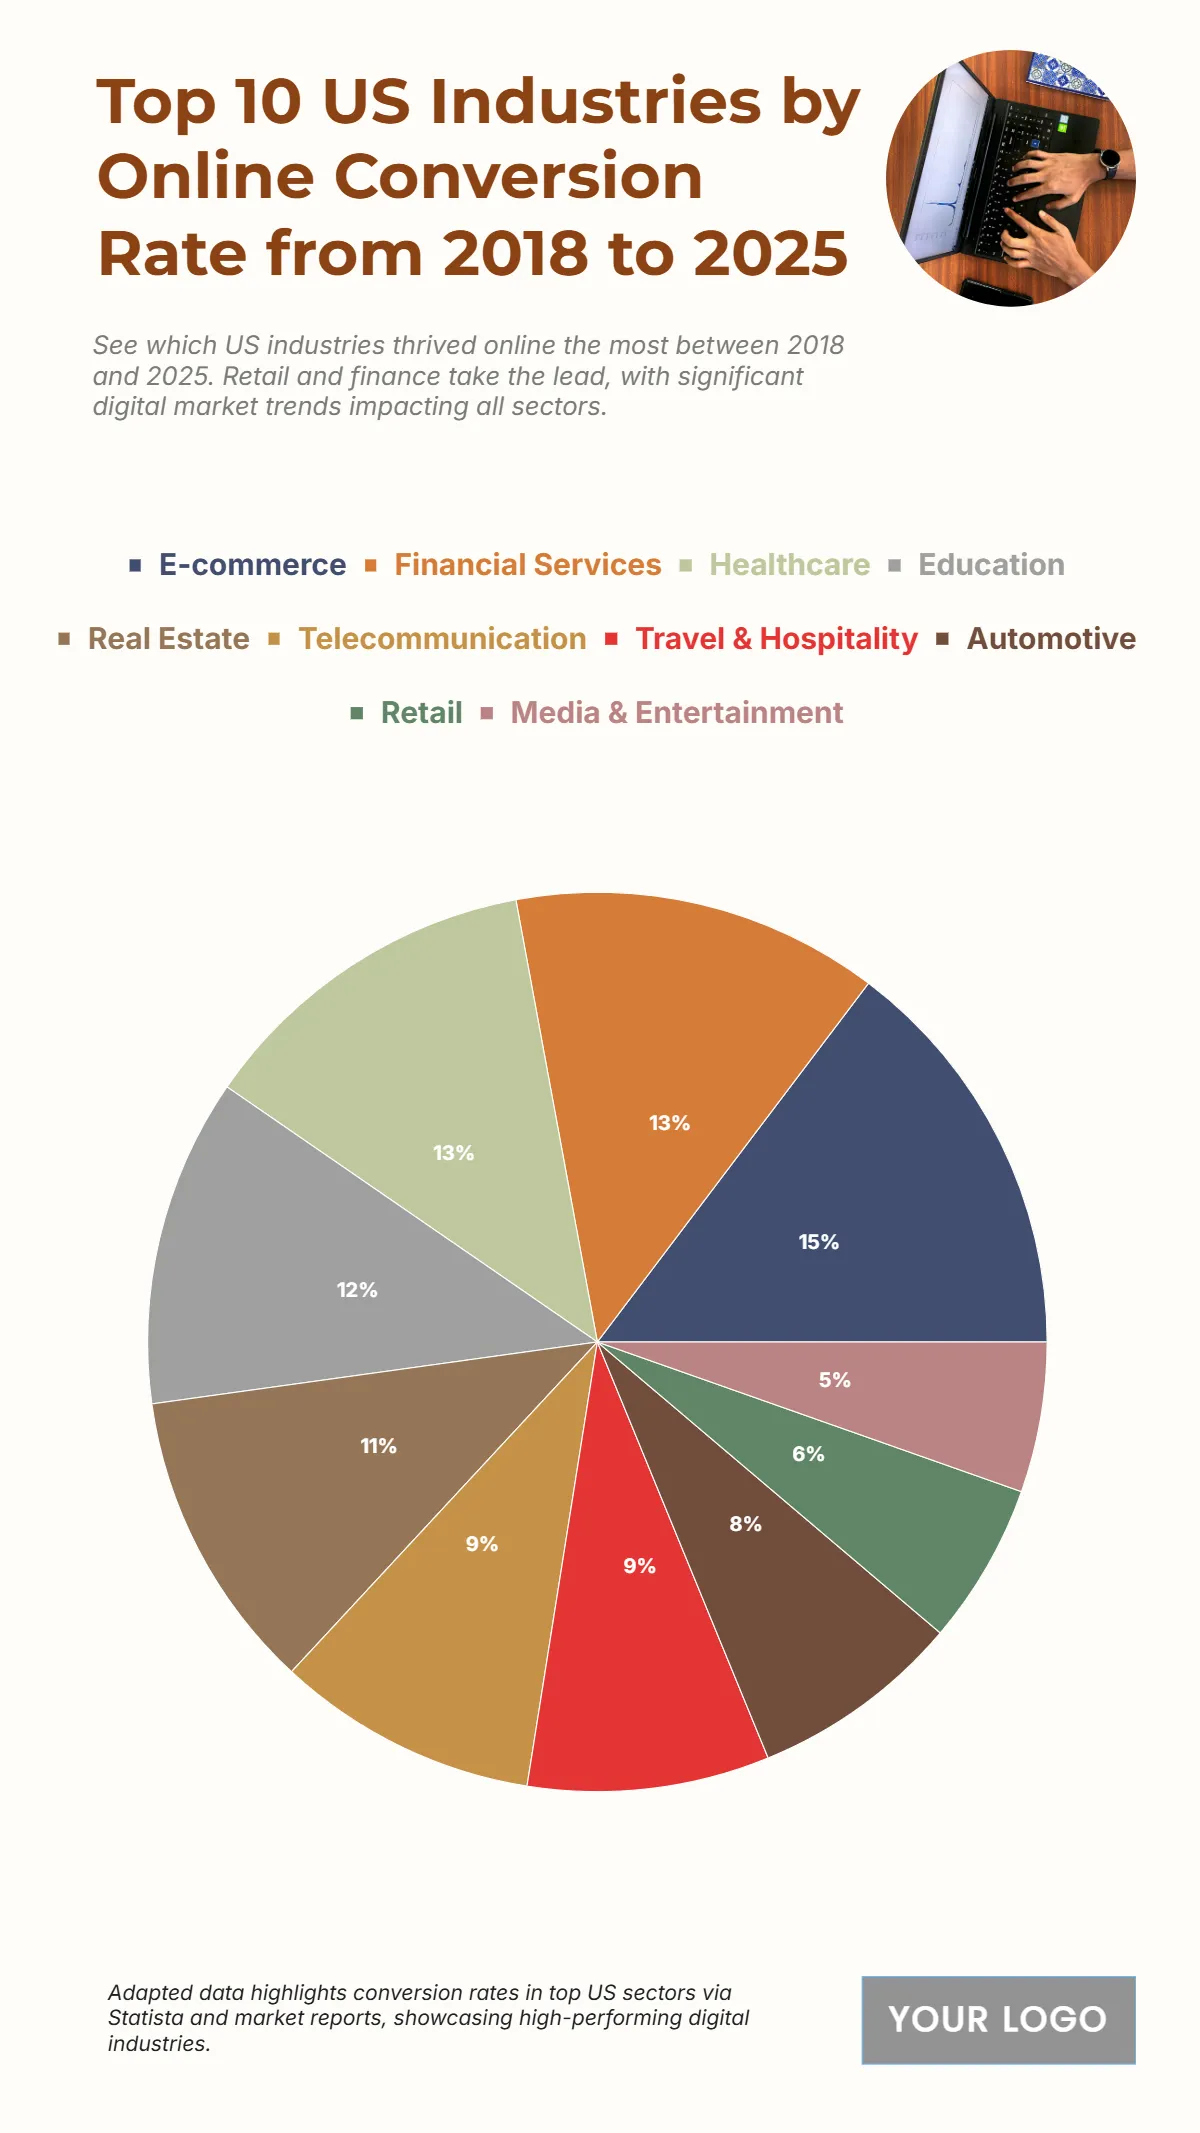
The chart showcases the top-performing U.S. industries in online conversion rates between 2018 and 2025, reflecting how different sectors adapted to digital transformation. E-commerce leads with an impressive 14.7% average conversion rate, driven by growing online retail activity, convenience, and personalized marketing. Financial Services follows closely at 13.2%, fueled by digital banking, fintech apps, and increased trust in online transactions. Healthcare and Education record 12.5% and 11.8%, respectively, as telehealth and e-learning become mainstream. Meanwhile, Real Estate achieves 10.9%, supported by virtual tours and digital listings, while Telecommunication sees 9.4%, reflecting expanding digital connectivity. Travel & Hospitality posts 8.7%, showing a rebound in post-pandemic booking behavior. Automotive, at 7.6%, signals rising online vehicle research and purchasing trends. Lastly, Retail (5.8%) and Media & Entertainment (5.4%) round out the list, highlighting steady but lower engagement compared to digital-centric sectors.
| Labels | 2018–2025 Average Conversion Rate (%) |
|---|---|
| E-commerce | 14.7 |
| Financial Services | 13.2 |
| Healthcare | 12.5 |
| Education | 11.8 |
| Real Estate | 10.9 |
| Telecommunication | 9.4 |
| Travel & Hospitality | 8.7 |
| Automotive | 7.6 |
| Retail | 5.8 |
| Media & Entertainment | 5.4 |


