Free US Mobile vs Desktop Ad Spend from 2015 to 2025 Chart
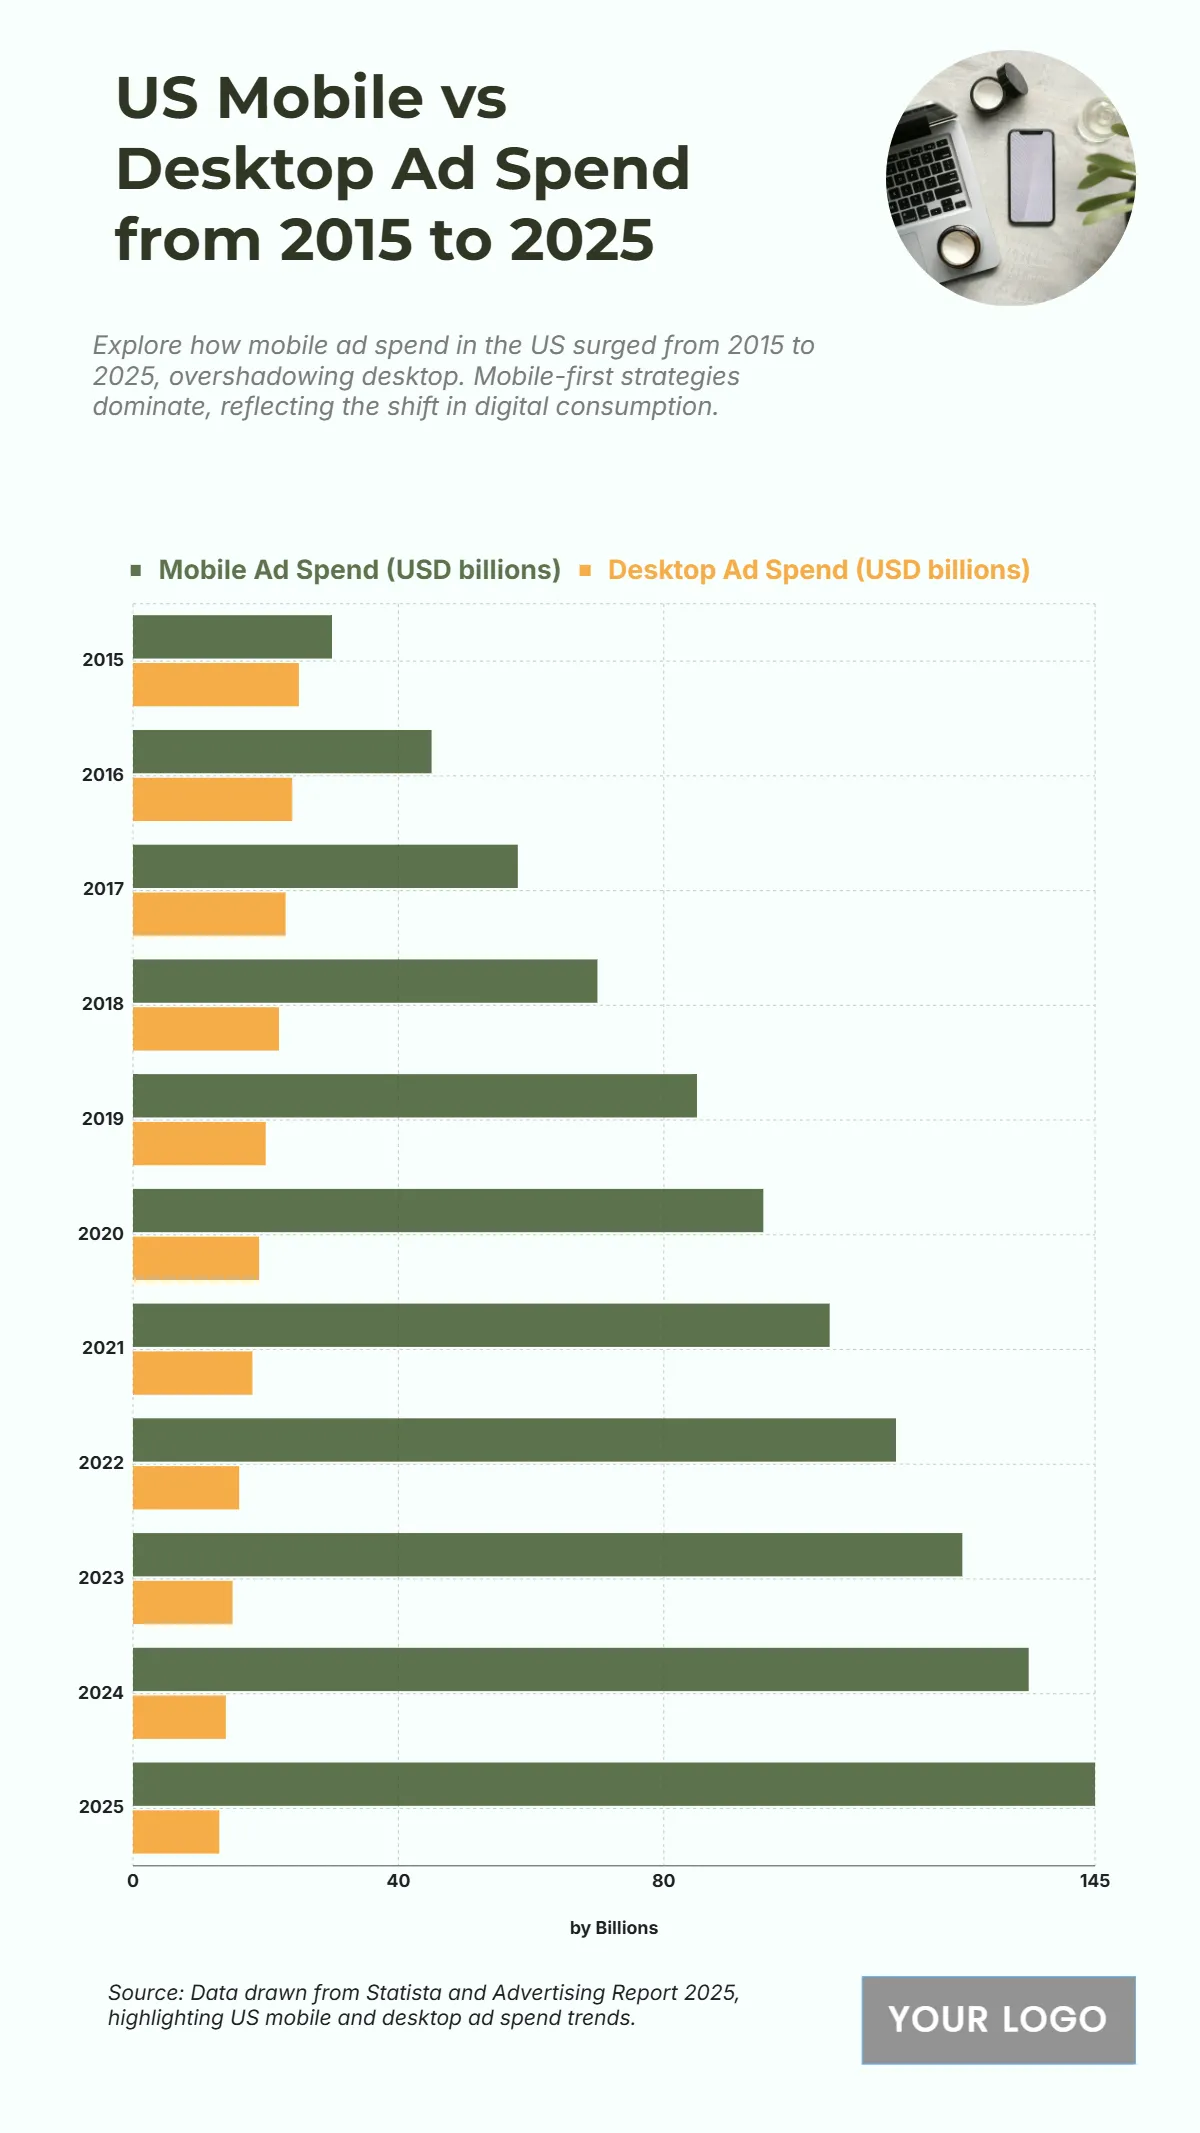
The chart highlights the steady rise of mobile advertising expenditure in the U.S. from 2015 to 2025, showcasing the industry’s growing focus on mobile-first marketing. Mobile ad spend starts at $30 billion in 2015 and surges to $145 billion by 2025, marking a nearly fivefold increase over the decade. In contrast, desktop ad spend consistently declines, dropping from $25 billion in 2015 to $13 billion in 2025, reflecting the decreasing reliance on traditional computer-based advertising. The most significant shift occurs after 2018, when mobile spending ($70 billion) overtakes desktop’s $22 billion, signaling a complete transition toward mobile platforms. By 2023, the gap widens dramatically, with mobile reaching $125 billion, compared to only $15 billion on desktop. This trend underscores the dominance of smartphones, social media apps, and mobile video consumption as the primary drivers of digital advertising in the modern U.S. market.
| Labels | Mobile Ad Spend (USD billions) | Desktop Ad Spend (USD billions) |
|---|---|---|
| 2015 | 30 | 25 |
| 2016 | 45 | 24 |
| 2017 | 58 | 23 |
| 2018 | 70 | 22 |
| 2019 | 85 | 20 |
| 2020 | 95 | 19 |
| 2021 | 105 | 18 |
| 2022 | 115 | 16 |
| 2023 | 125 | 15 |
| 2024 | 135 | 14 |
| 2025 | 145 | 13 |


