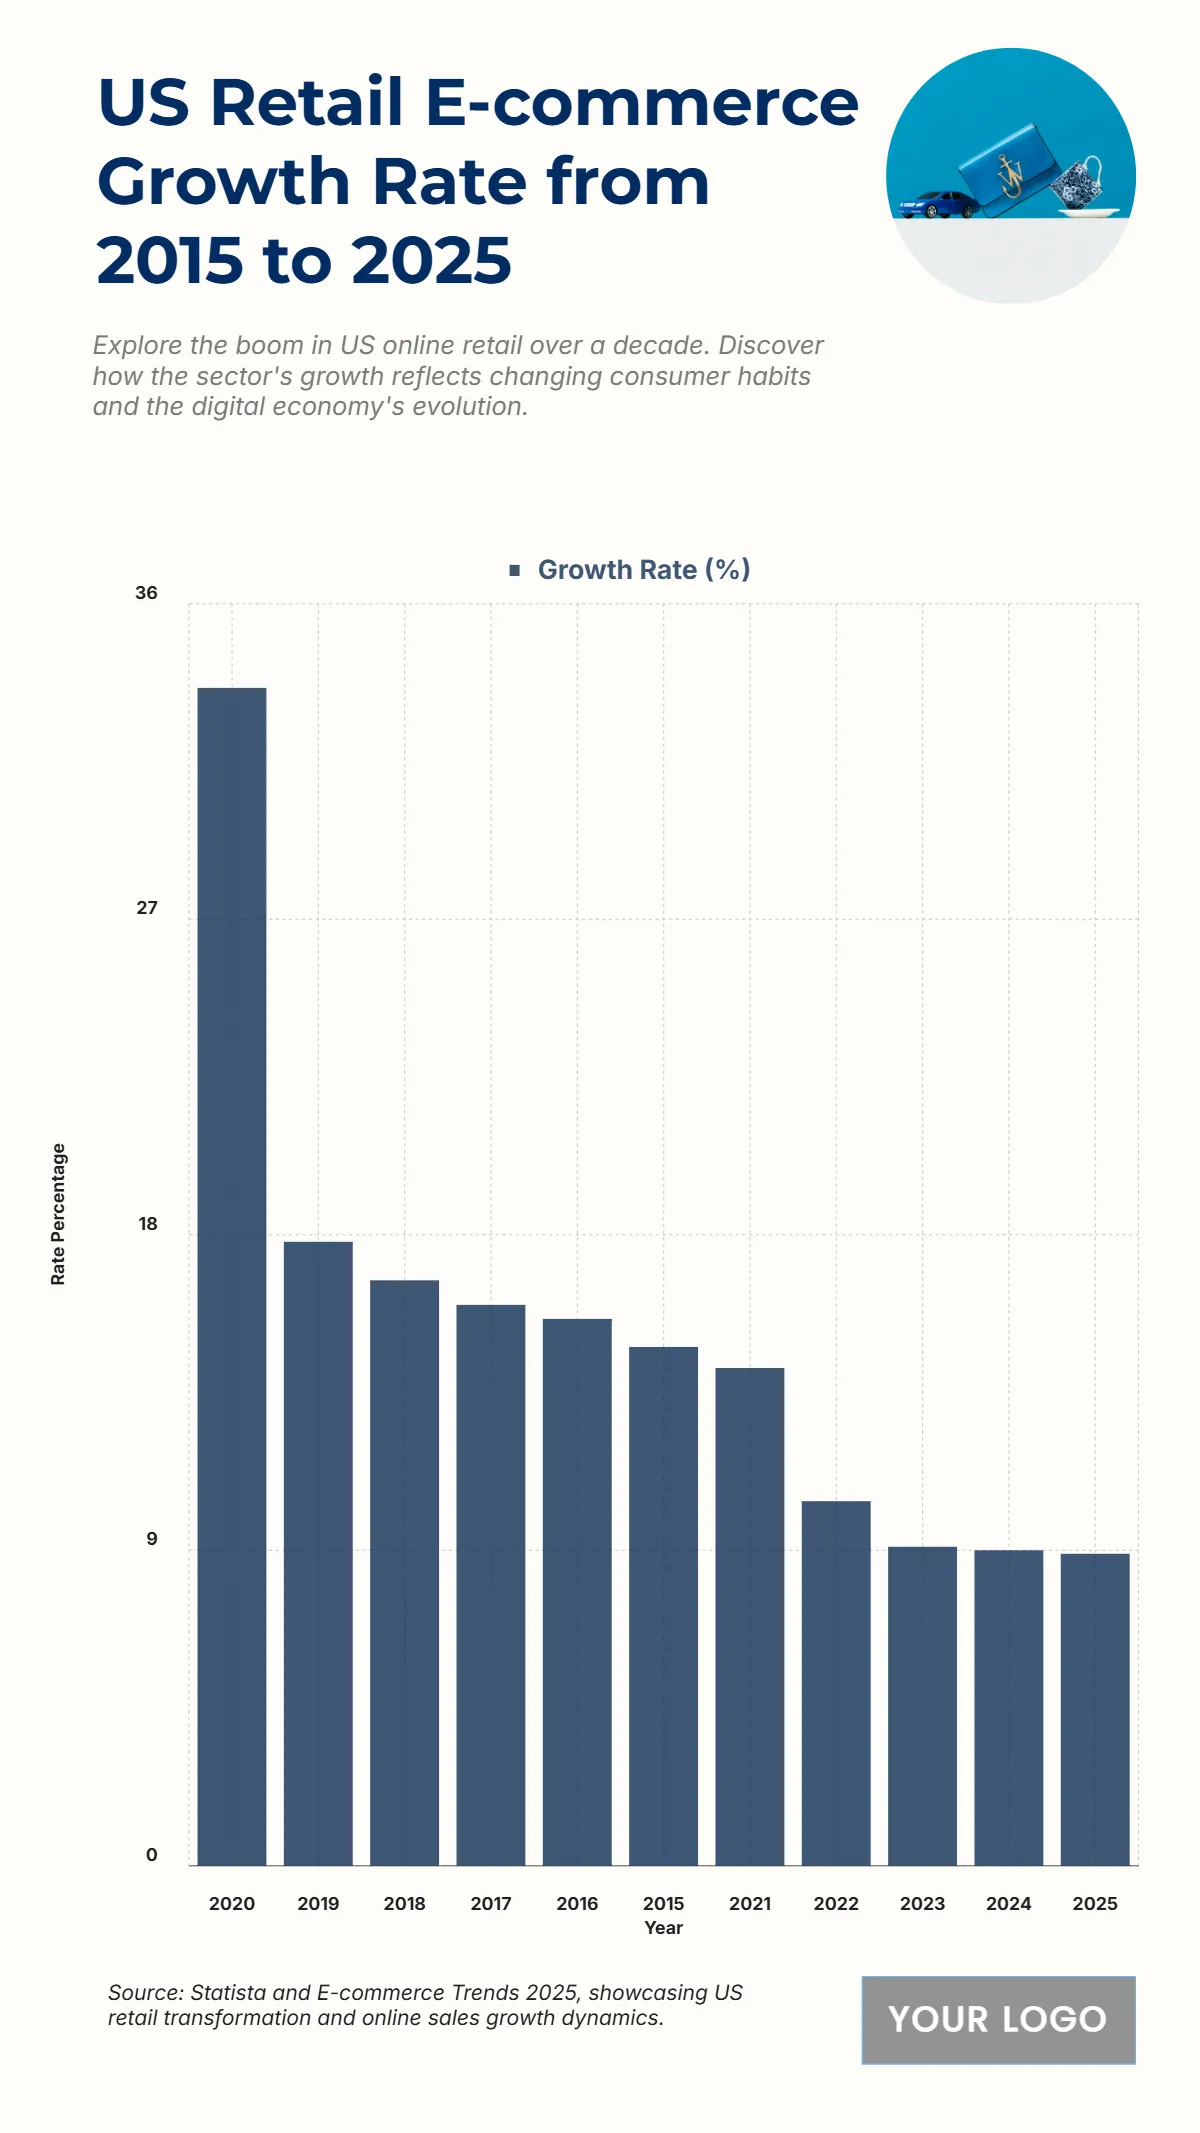
Free US Retail E-commerce Growth Rate from 2015 to 2025 Chart
The chart illustrates the steady evolution of U.S. retail e-commerce growth rates from 2015 to 2025, highlighting key digital shifts influenced by consumer behavior and global market dynamics. The data reveals a dramatic surge in 2020, where growth peaked at 33.6%, largely driven by the pandemic’s acceleration of online shopping adoption. This spike nearly doubled the 2019 rate of 17.8%, marking the most significant single-year leap in the decade. However, following 2020, growth steadily normalized, dropping to 14.2% in 2021, then to 10.4% in 2022, and eventually stabilizing around 9% by 2024 and 8.9% by 2025. Earlier years—2015 to 2019—show consistent increases from 14.8% to 17.8%, reflecting the sector’s digital maturity before the pandemic boom. Overall, the chart underscores how e-commerce has transitioned from rapid expansion to sustained stability, signifying a maturing market increasingly integrated into mainstream retail.
| Labels | Growth Rate (%) |
|---|---|
| 2020 | 33.6 |
| 2019 | 17.8 |
| 2018 | 16.7 |
| 2017 | 16.0 |
| 2016 | 15.6 |
| 2015 | 14.8 |
| 2021 | 14.2 |
| 2022 | 10.4 |
| 2023 | 9.1 |
| 2024 | 9.0 |
| 2025 | 8.9 |


